The 6QA Analytics report provides a summary of current 6sense Qualified Accounts (6QAs). It helps marketing and demand generation teams ensure that their 6QAs are being successfully handed off to sales teams. The analytics help you to answer questions such as:
For my selected segment and product, how many 6QAs do I have?
Are those 6QAs being worked on by the sales team?
Are there enough activities for each 6QA to drive them down your sales funnel?
6QAs by default are based on account intent scores and profile fit, though Administrators or Operators can customize the definition of a 6QA. Refer to 6sense Qualified Accounts (6QA).
You can set up a 6QA Analytics report and apply filters, then save it for future use and share it using its URL.
Prerequisites
The Predictive add-on.
An active Predictive model.
All ABM users in 6sense can view the report. SI users must be Primary or Sales Administrators to view the report; Sales SDR and AE users cannot access the report.
Create a 6QA analytics report
Th 6QA Analytics report shows you the number of that are currently identified as 6QAs.
Start a new 6QA analytics report
To start a new 6QA Analytics report:
Go to ABM > Reports.
Select 6QA Analytics.
The 6QA Analytics report opens.
There are two main tabs:
Dashboard: The view that organizes your 6QAs into various breakdowns. This is the tab where you set up a report.
Accounts: The list of accounts. You can search and download the list.
Set the report options
To set up a 6QA Analytics report:
Set the options. Options that affect the entire report are at the top right of the page. Options include:
All 6QAs, or select a segment: The default, All 6QAs, includes every account that is currently a 6QA. You can select a segment instead. A message informs you if the segment you select does not have any 6QAs.
Product category (Predictive model): If there is only one product category/model configured, then this option doesn’t appear. If you have multiple products/models, you can select one at a time.
Filters: Select the filter icon to open the Filters panel.
Filters include:
Accounts in your CRM and/or not in your CRM: Companies that have a matching name and country in the CRM.
6QA Status: Unworked and/or Worked.
Days since 6QA Creation: The default and maximum is 90 days.
Days to First Sales Activity: The default and maximum is 90 days.
Days Since Last Activity: The default and maximum is 90 days.
Sales Activities: Number of sales activities. The default and maximum is 50+.
Reached Contacts: Number of reached contacts. The default and maximum is 25+.
Select Apply after setting the filters.
After you set up the options, select Save (the floppy disk icon).
Copy the link (the link icon at the top far right) to the report and share it with other 6sense users.
Dashboard tab metrics
Dashboard tab KPIs
The KPIs panel shows key metrics.
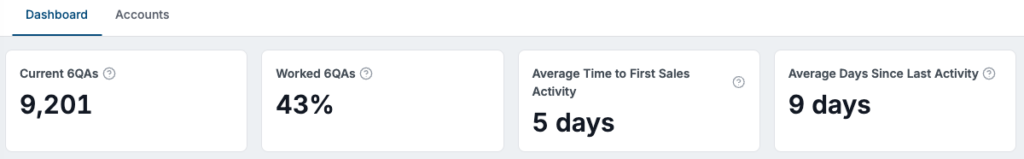
Current 6QAs: The number of accounts that are currently a 6QA. When an account no longer qualifies as a 6QA, it is removed from this count.
Worked 6QAs: The percentage of 6QAs with one or more sales activities (phone call, email, or voicemail) while in the 6QA status.
Average Time to First Sales Activity: For all 6QAs with at least one sales activity, the number of days, on average, it took till that first sales activity.
Average Days Since Last Activity: For all 6QAs with at least one sales activity, the number of days, on average, it has been since the last sales activity.
If an account was a 6QA in the past and a 6QA for a subsequent time, 6sense only counts the sales activities while it’s a 6QA this time.
Tip: Strive to have this number as low as possible. If an account is a 6QA, it’s likely that people there are already researching your competitors. Sales activity with the account increases the likelihood of converting it to an opportunity.
6QA Status panel
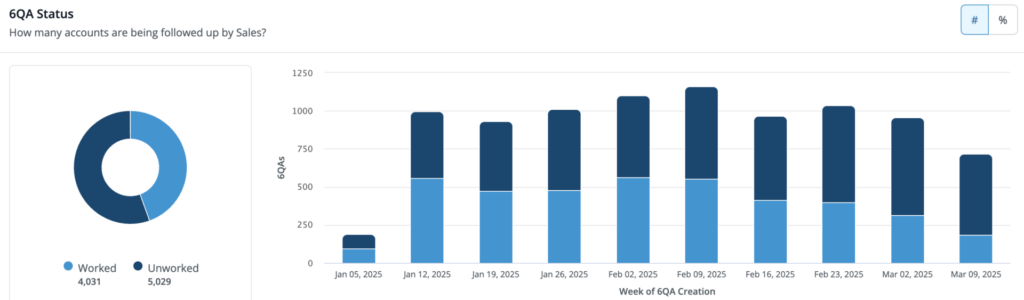
The 6QA Status panel displays:
A pie chart that breaks down the percentage of worked and unworked 6QAs.
A trend chart that shows, in weekly increments starting on Sundays, how many 6QA accounts were created during that week, with a breakdown of which accounts have been worked vs. not worked.
To see the bar chart as percentages, select the percentage button at the top right of the chart.
Tip: It might be okay if you have unworked 6QAs in the most recent weeks, but it should be a red flag if you have old unworked 6QAs.
Worked 6QAs
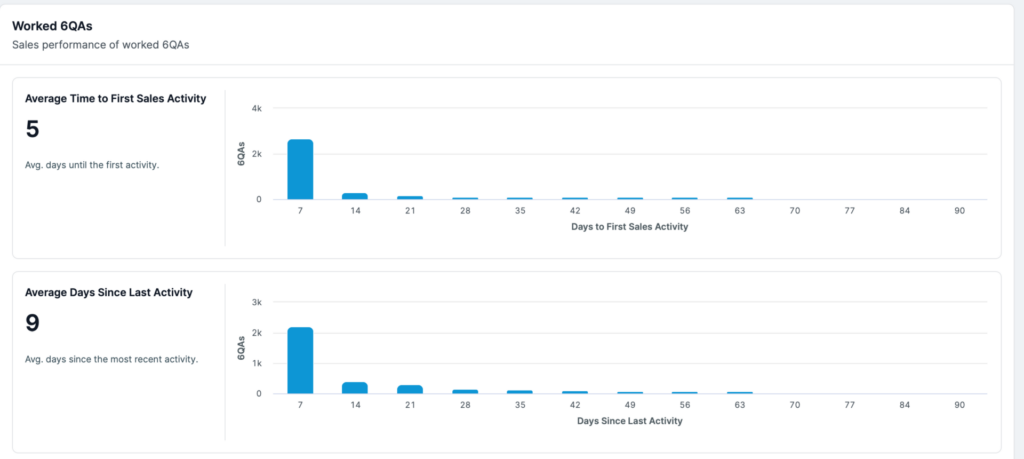
The Worked 6QAs charts measure the level of activity and speed to first activity of your sales team.
Tip: This is critical to ensure accounts are worked effectively to accelerate pipeline.
Average Time to First Sales Activity: The overall average number of days it takes your sales team to initiate their first outreach to 6QA accounts. The trend bar chart shows the distribution of 6QA accounts that are initially being responded to, broken out in 7 day (weekly) bars.
Average Days Since Last Activity: The overall average number of days your sales team reaches back out to 6QA accounts from the last activity.
Tip: Keeping this number low ensures that your sales team is providing sufficient activity to maintain engagement and drive accounts down funnel.
The trend bar chart shows the distribution of 6QA accounts that are being followed up with, broken out in 7 day (weekly) bars.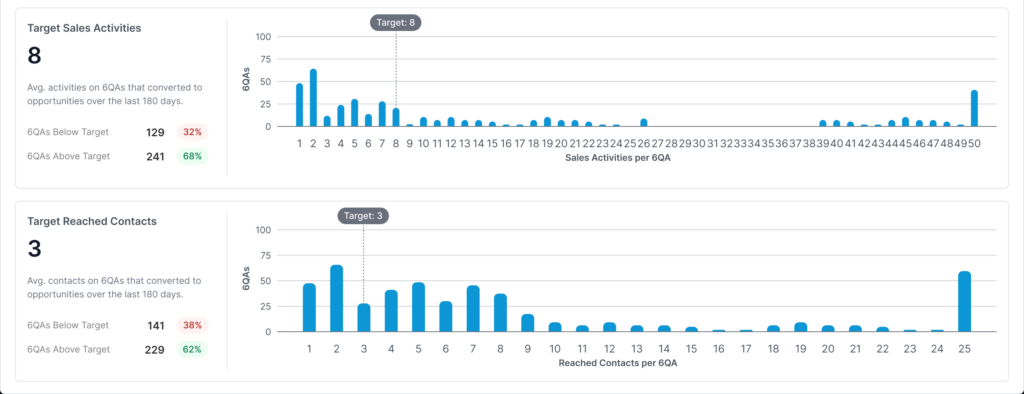
Target Sales Activity: The average number of activities on 6QAs that converted to opportunities over the last 180 days. The metrics show:
The target number of sales activities on all worked 6QAs.
The number and percentage of 6QAs above and below that target number.
The Sales Activities per 6QA chart shows the distribution of accounts by number of sales activities on the 6QA.
Target Reached Contacts: The average number of reached contacts on 6QAs that converted to opportunities over the last 180 days. The reached contacts metrics show:
The target number of reached contacts on all worked 6QAs.
The number and percentage of 6QAs above and below that target number.
The Reached Contacts per 6QA chart shows the distribution of accounts by number of reached contacts on the 6QA.
Tip: In order for a 6QA to convert to an opportunity, it typically requires multiple people on the account to be engaged.
How targets are calculated
6sense uses the IQR method to calculate the targets for sales activity and reached contacts, because it removes outliers which would skew the results. You can watch this tutorial about the IQR method and how it works.
Save a report
Use the Save button at the top right of the 6sense Analytics page to name your report and save it to a folder on the Reports page.
Accounts tab 6QA list
To get a list of 6QAs from the Accounts tab:
In a 6QA Analytics report, select the Accounts tab. It lists accounts and metrics for those accounts.
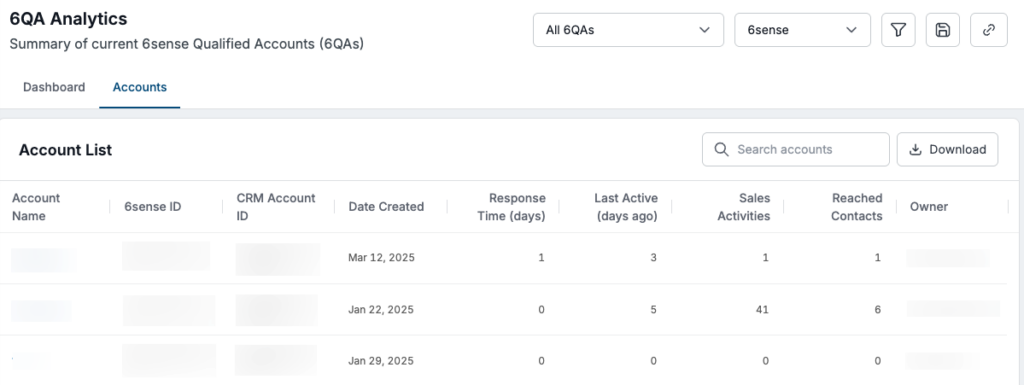
Use the buttons at the bottom to tab through the list.
Use Search to look for a specific account.
Select Download to export the list.
Get 6QA details from the Accounts tab
To explore details about an account, from the Accounts tab list select an account name to open the Account details page.