The Usage Report allows an administrator to visualize and analyze an organization’s usage of 6sense. You can also download some of that data to CSV files for further analysis. Usage reports include user metrics, product metrics, and other metrics.
This article covers the Sales Intelligence reports under Usage. View Usage Metrics for more information on the other Usage Reports.
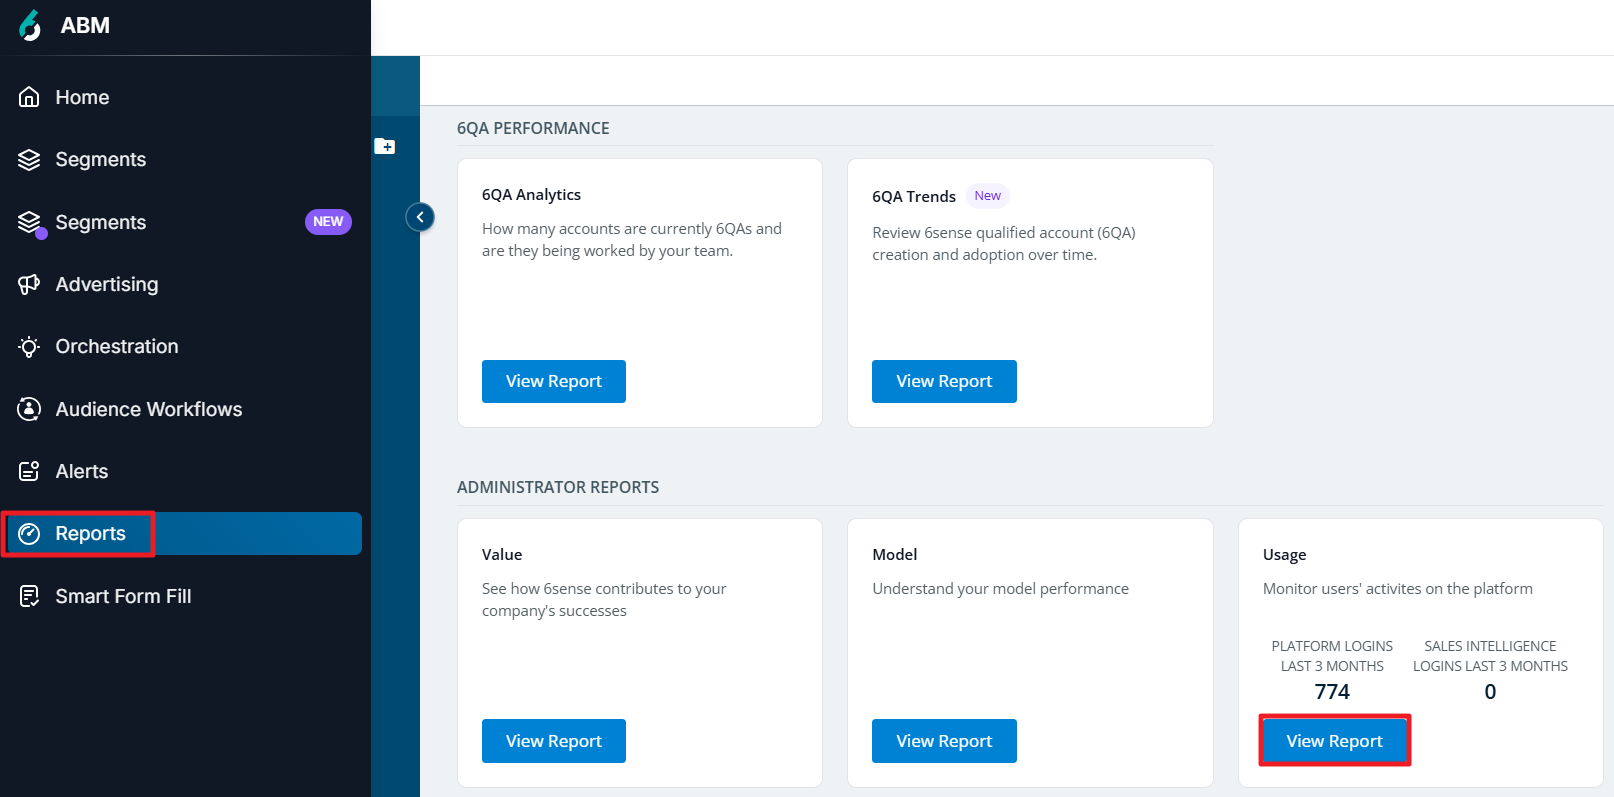
To view usage reports, select Reports in the left navigation, then click View Report in the Usage card in the Administrator Reports section.
The Usage Report shows multiple tabs: User Metrics, Product Metrics, APIs & SFF or CRM/MAP Metrics. SI reports appear under User Metrics and Product Metrics.
.png)
You can select a timeframe for each displayed bar chart report.

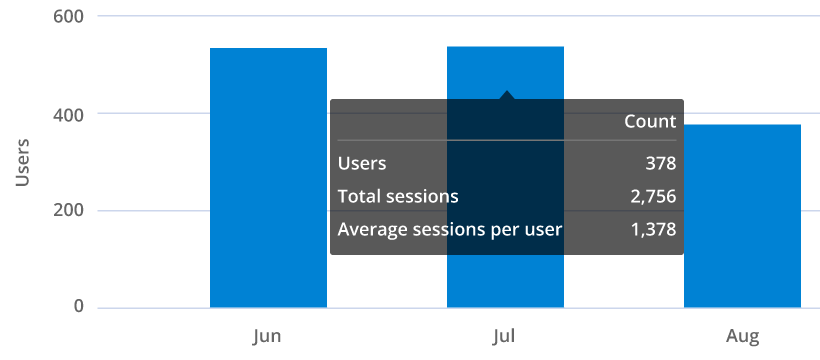
Hover over a bar on the chart to view details, and click on a bar to view a popup displaying a table with further details for the selected time period.
You can download the detail table data from many of these detail popup views into a csv file.

User Metrics
The User Metrics tab shows bar chart visualization cards of Platform logins and Sales Intelligence logins.
Sales Intelligence Logins
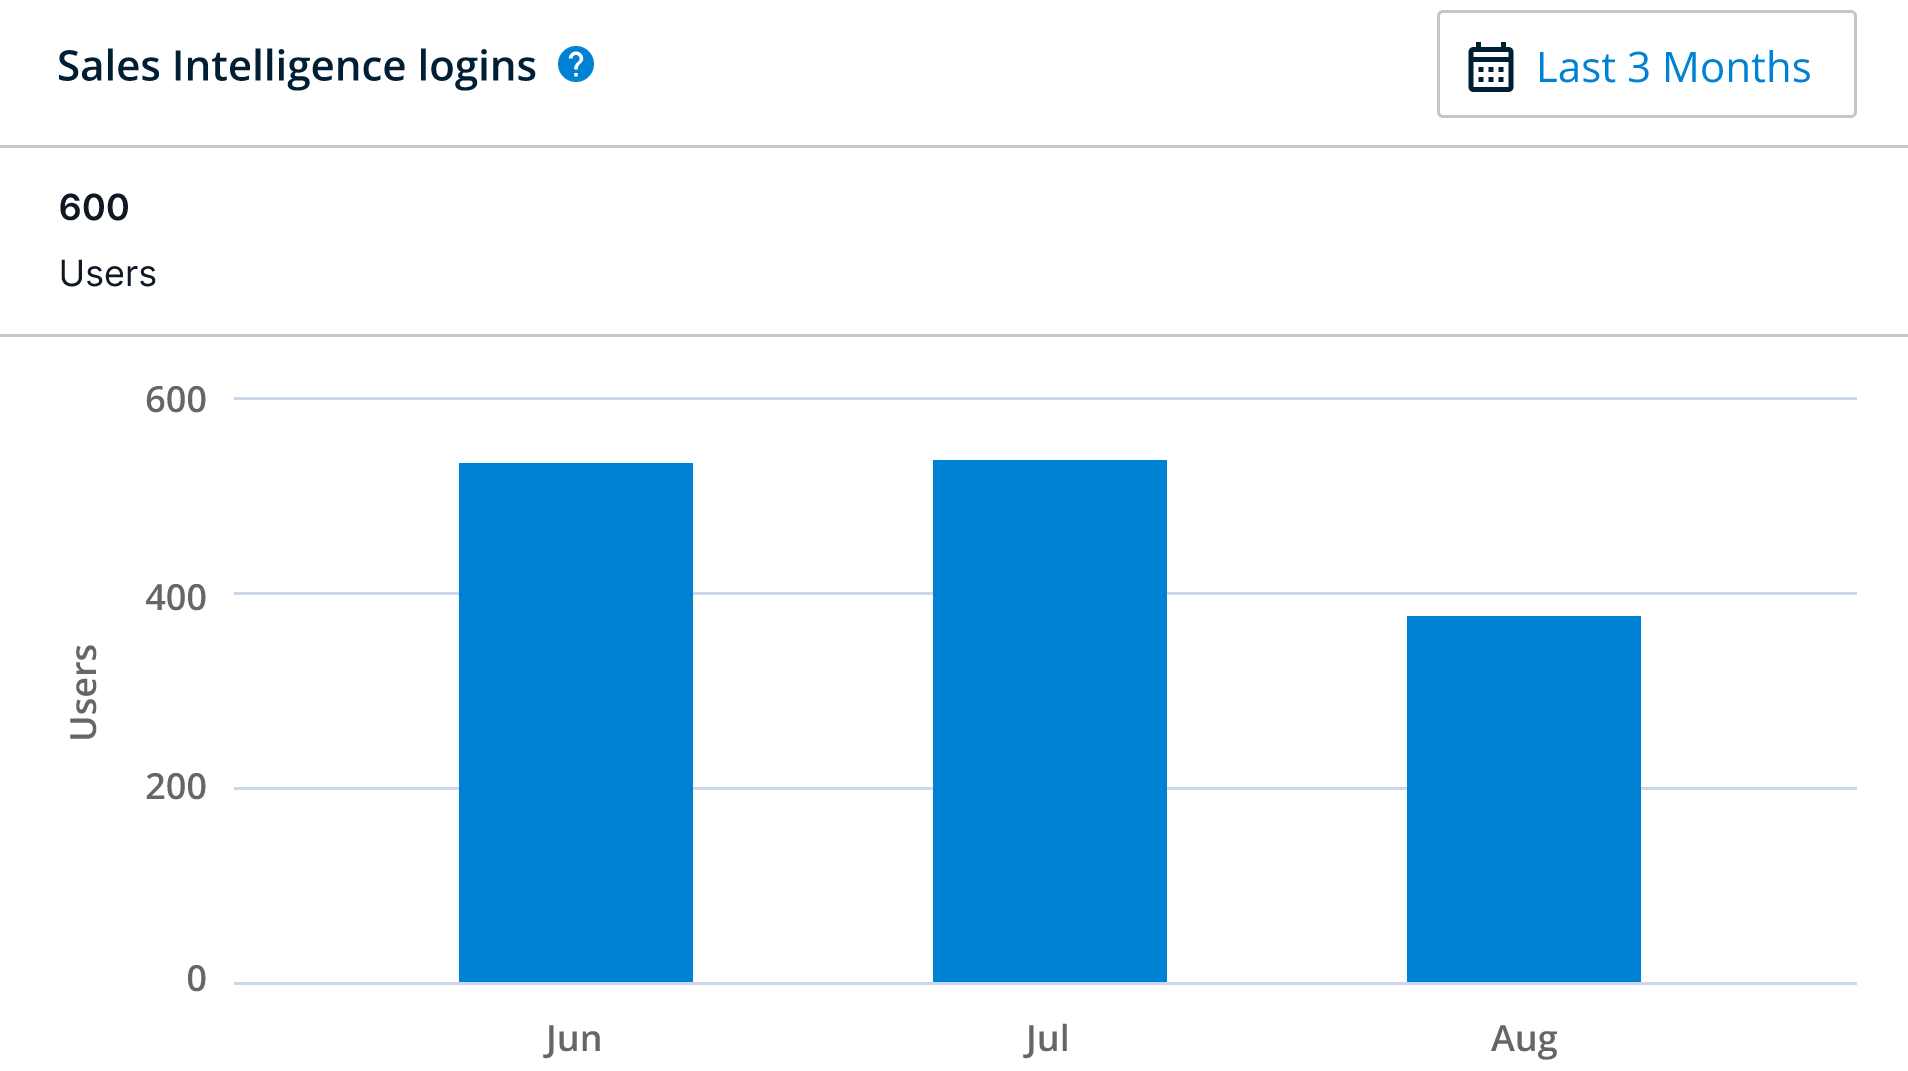
The Sales Intelligence Logins card displays the total Sales Intelligence user logins within the selected timeframe.
The information displayed is based on the number of users that had access to Sales Intelligence and is estimated based on page views where login is not available. (Note that the information displayed is not the total number of users who are using Sales Intelligence.)
For Sales Intelligence, any interaction on any source (for example, interaction in the iFrame in Salesforce, in the 6sense Dashboards in SalesLoft, and so on) is counted toward this report.
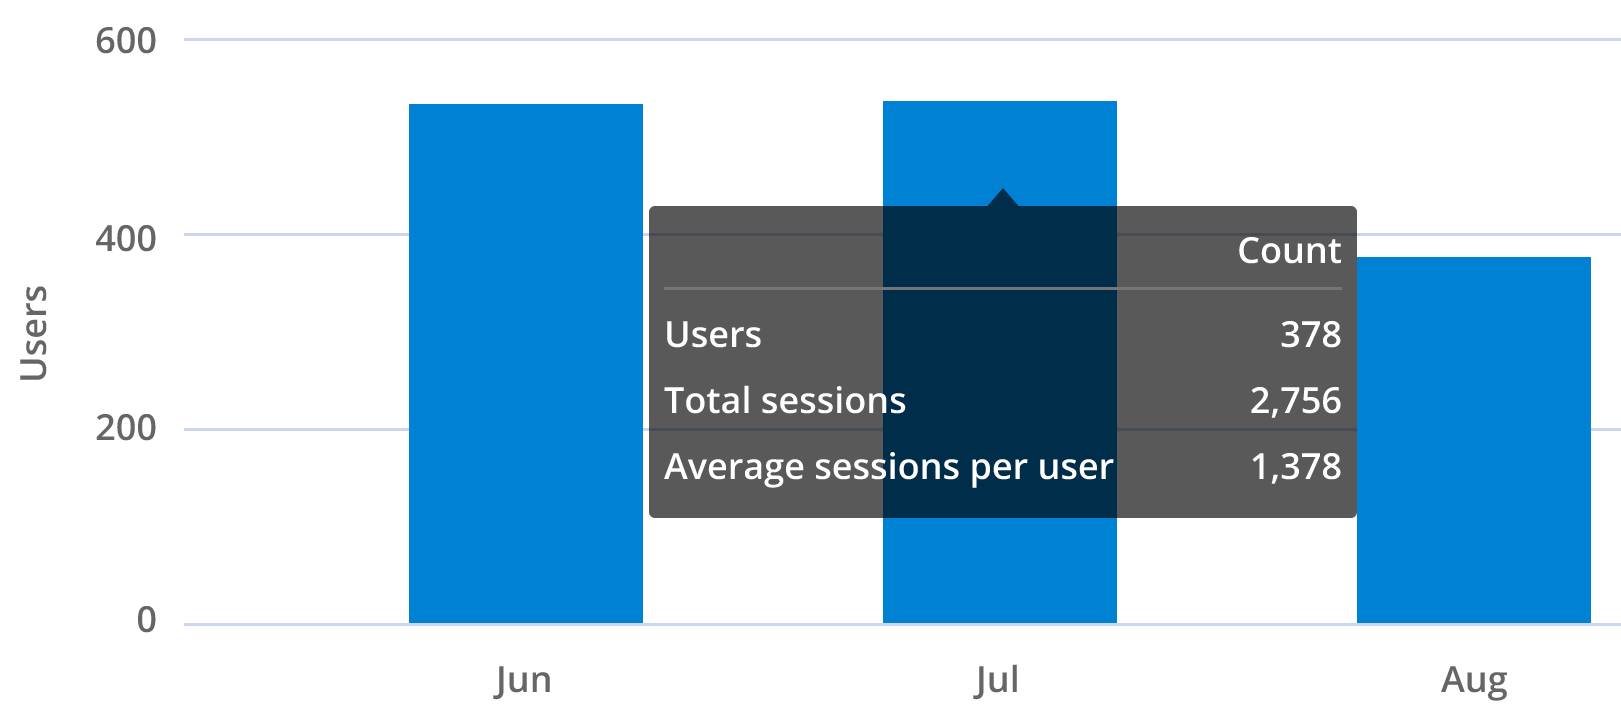
Hover over any bar in the chart to display details including:
# of users that logged in: The total number of Sales Intelligence users logged in within the selected time period.
Total sessions: The total number of sessions users spent on 6sense.
Average sessions per user: The average number of 6sense sessions per user.
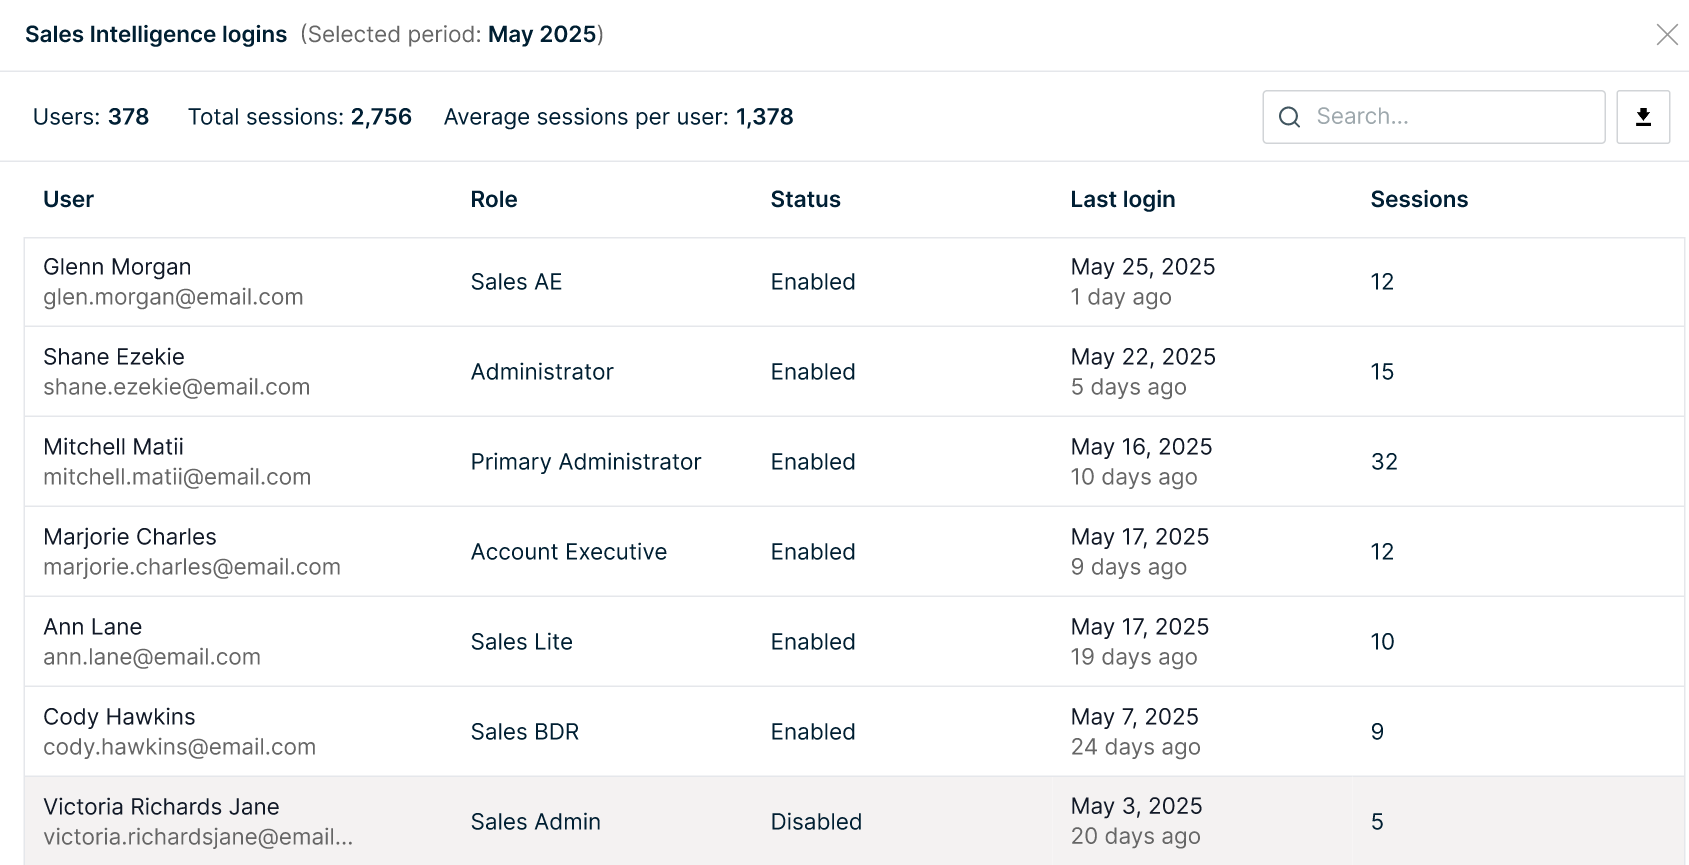
Click on a bar on the chart to open a popup window with more details, including:
User names and emails
User role
User status
Last login date
Number of sessions per user
Note that the user role and title only populate in Sales Intelligence usage reporting if the user is registered on the 6sense platform.
Sales Intelligence Adoption

The adoption report allows admins to view and monitor which users are adopting the 6sense Sales Intelligence tool by comparing days active, number of interactions, and the type of interactions, where they're using the tool the most and more.
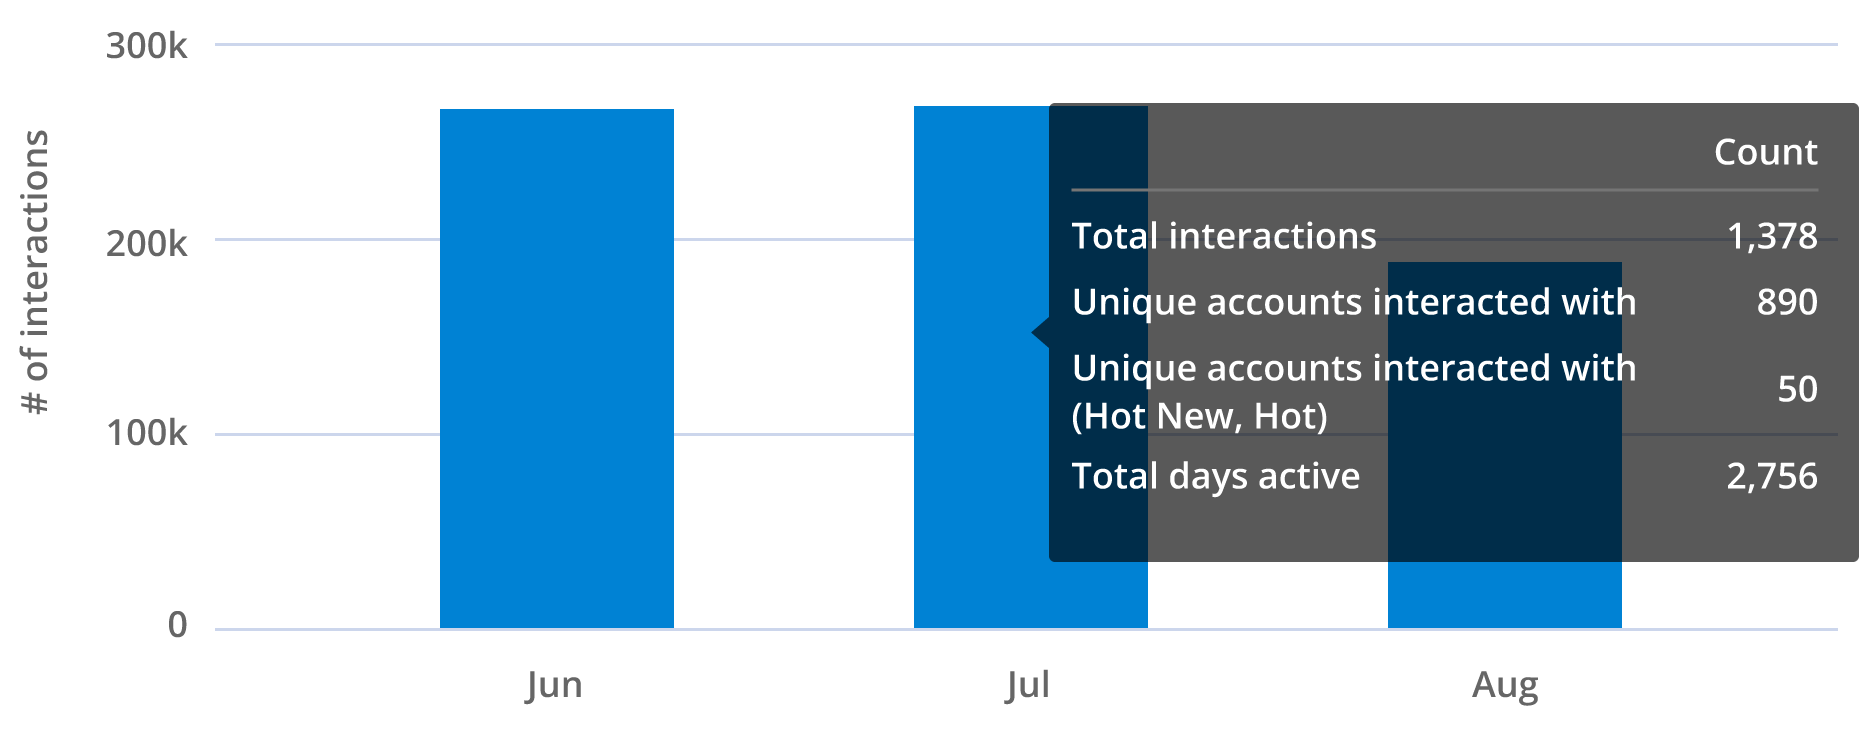
Hover over any bar in the chart to display details including:
Total interactions: The total times users interacted with the SI product.
Unique accounts interacted with: The number of unique accounts users interacted with in SI.
Unique accounts interacted with (Hot New, Hot): The number of unique Hot New and Hot accounts users interacted with in SI.
Total days active: The total number of days users have been active in the SI product.
Click on a bar on the chart to open a popup window with more details, including:
User names and emails
User role
User status
First interaction
Last interaction
Days active
Accounts interacted with
Accounts interacted with (Hot New, Hot)
Total interactions
Iframe page loads
.png)
Downloading this report provides additional data, which includes:
Iframe interactions
CRM page loads
SEP page loads
Product Metrics
The Product Metrics tab shows bar chart visualization cards of interactions with the product.
Sales Intelligence Credit Usage
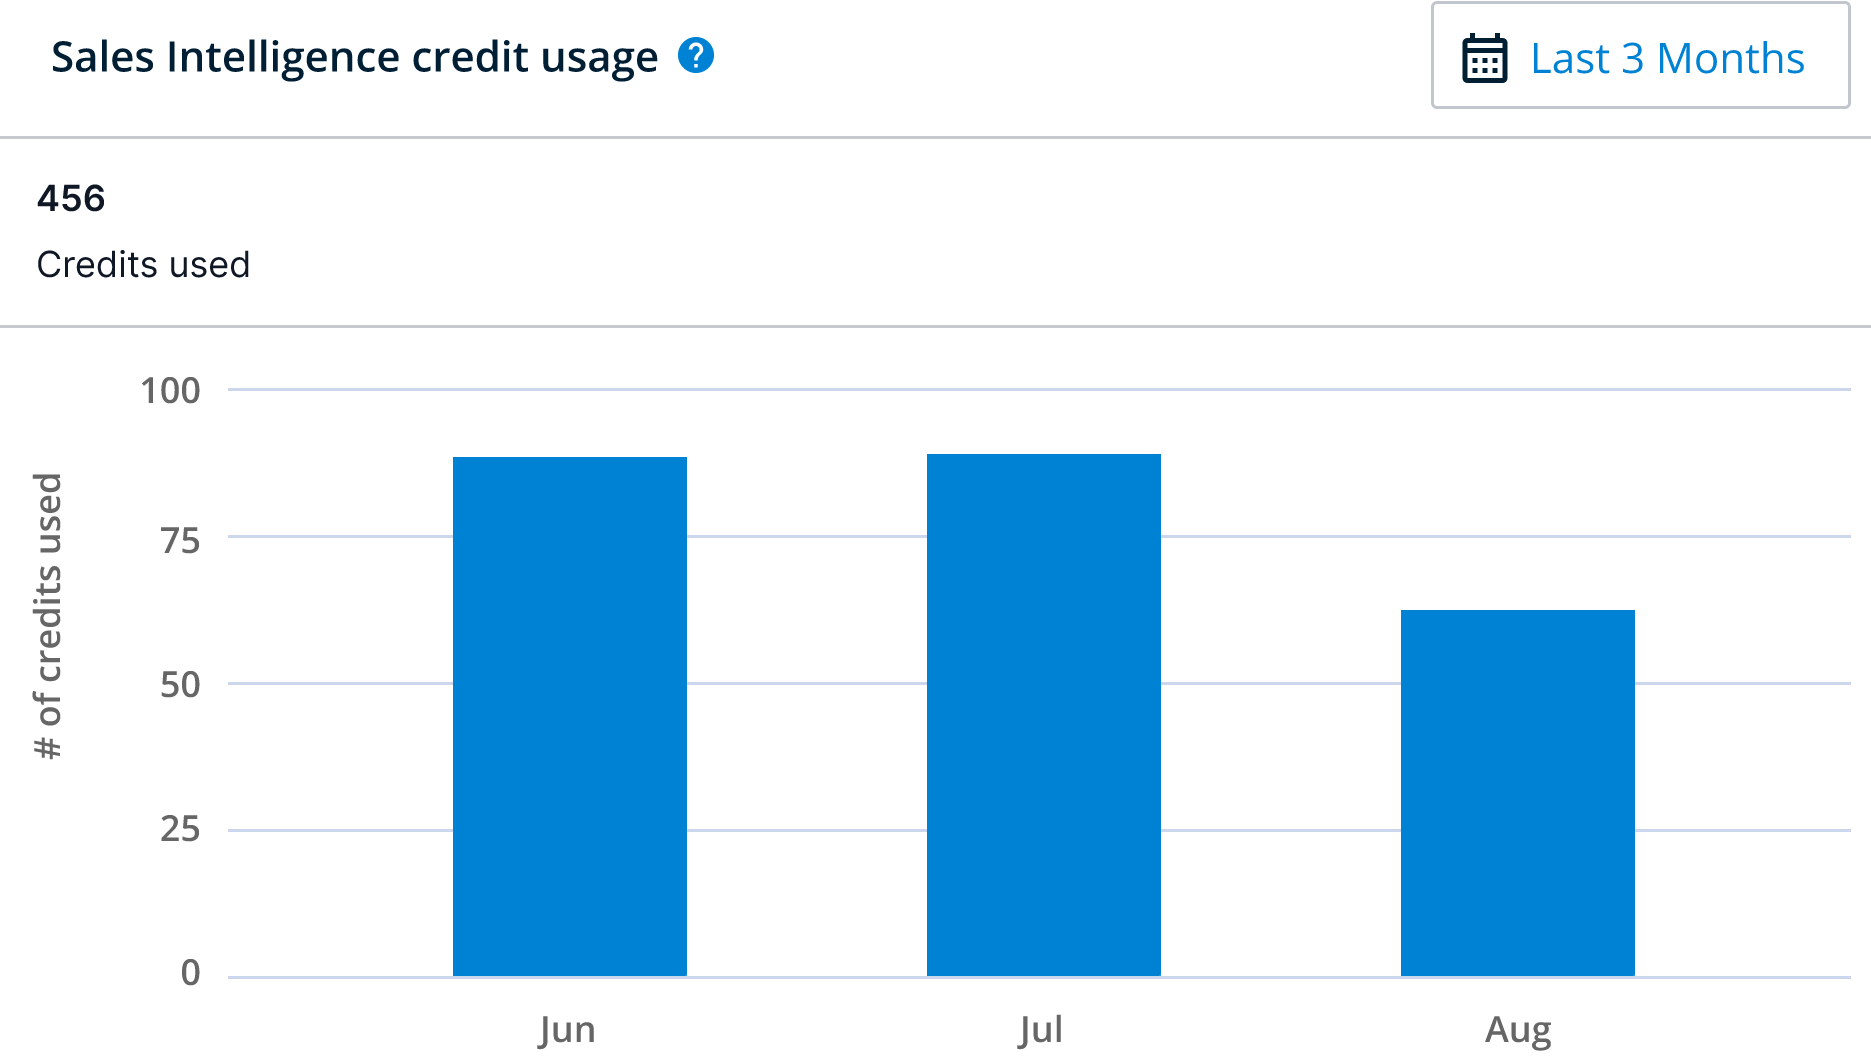
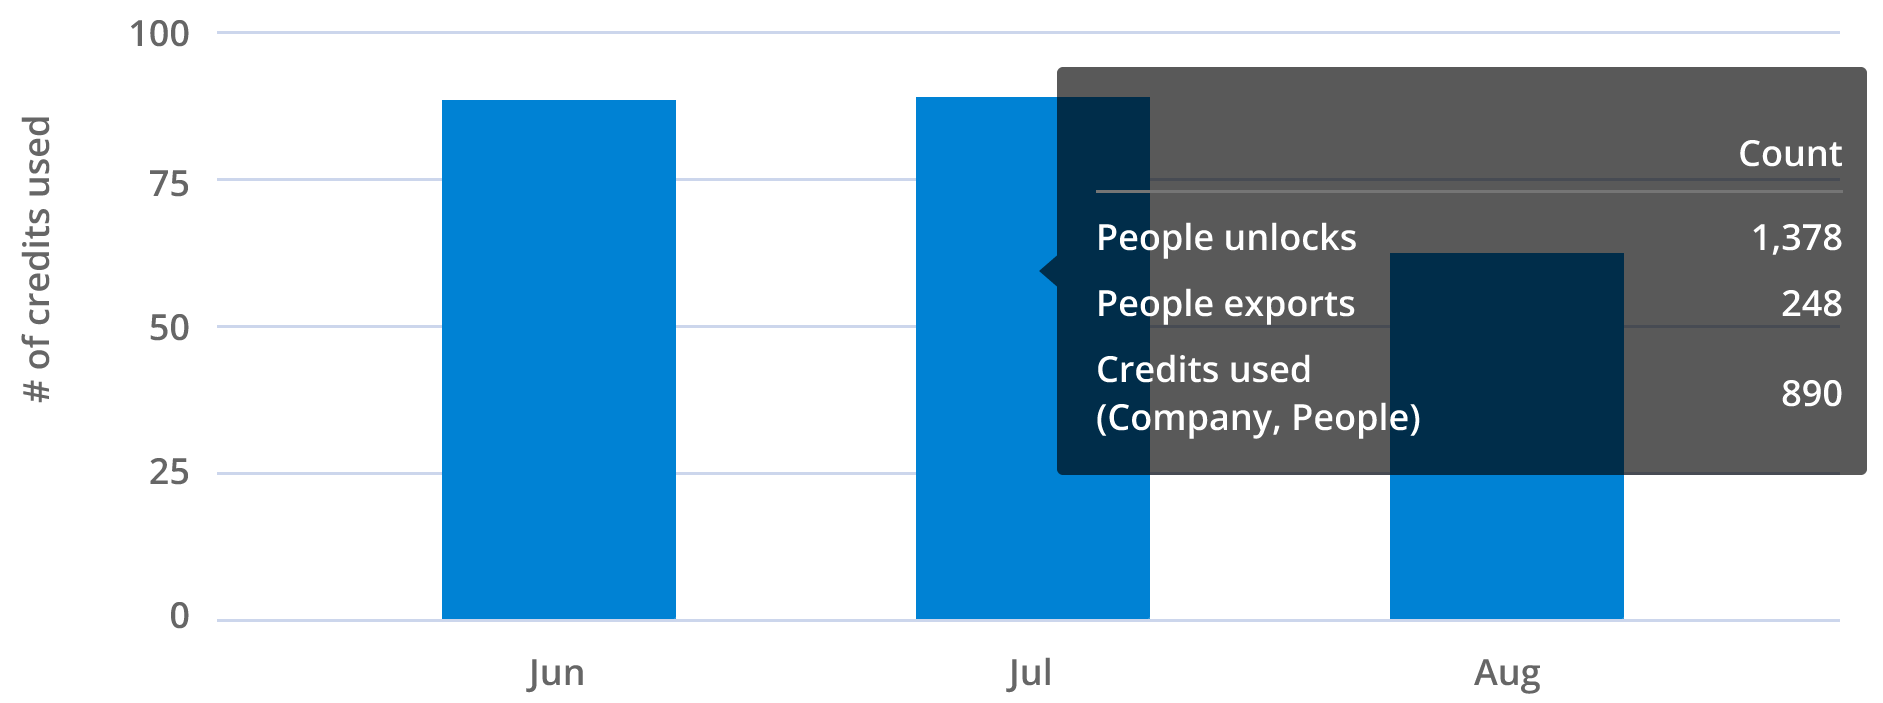
The Sales Intelligence Credit Usage card displays the number of credits used in SI in the selected timeframe.
Hover over any bar in the chart to display details including:
People unlocks: Total people accounts unlocked using credits.
People exports: Total people accounts exported.
Credits used (Company, People): Total credits used on both company and people accounts.
Click on a bar on the chart to open a popup window with more details, including:
User names and emails
User role
User status
Company credits used
People credits used
People unlocks
People exports
Total credits used
.png)
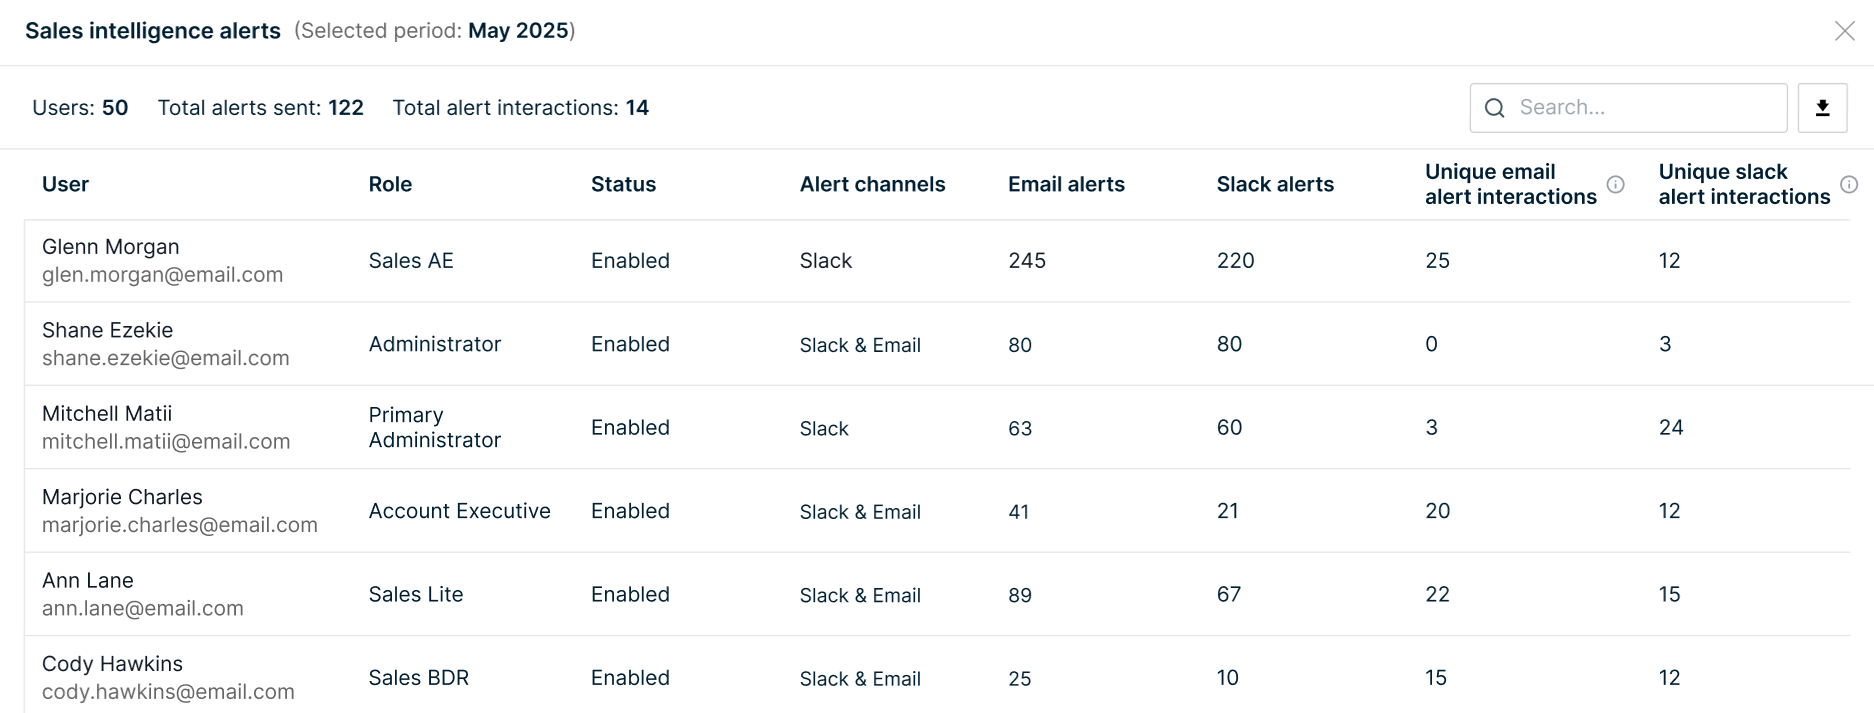
Sales Intelligence Alerts
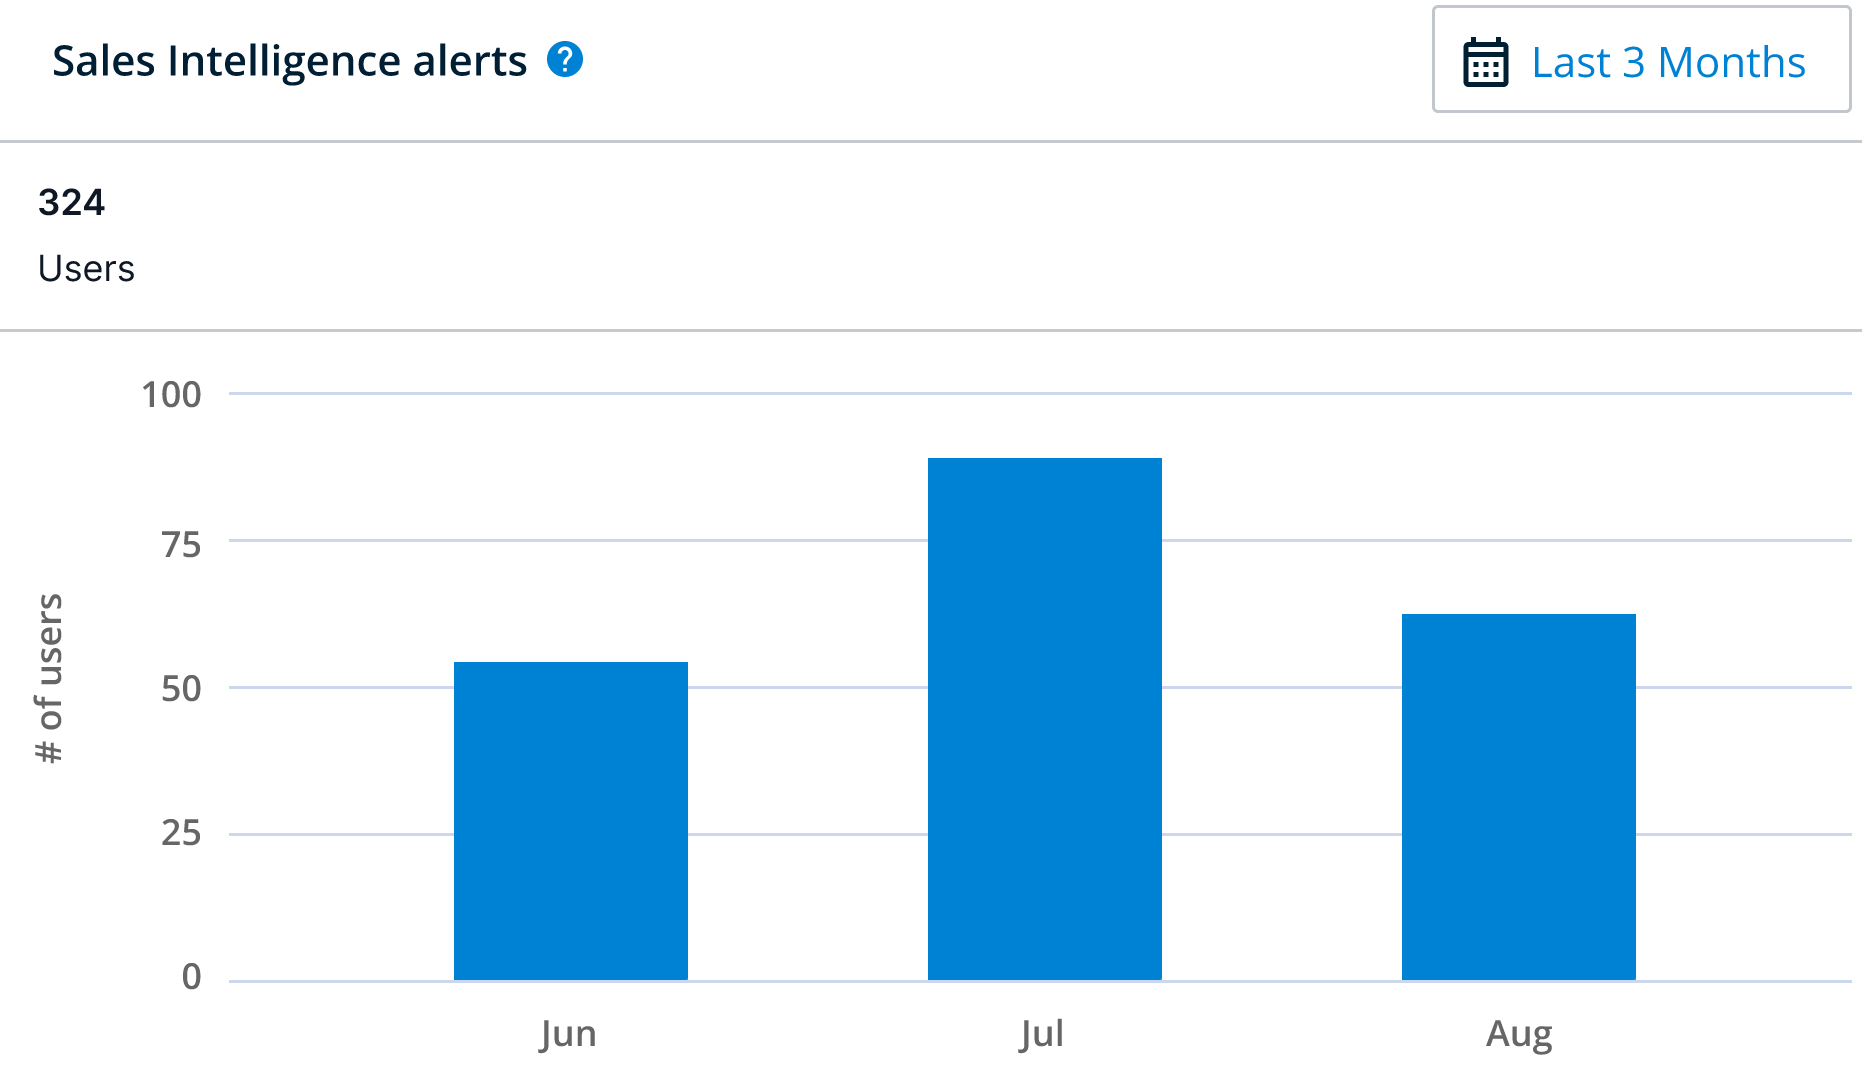
The alerts report allows for admins to track that alerts are being received and actioned on within SI.
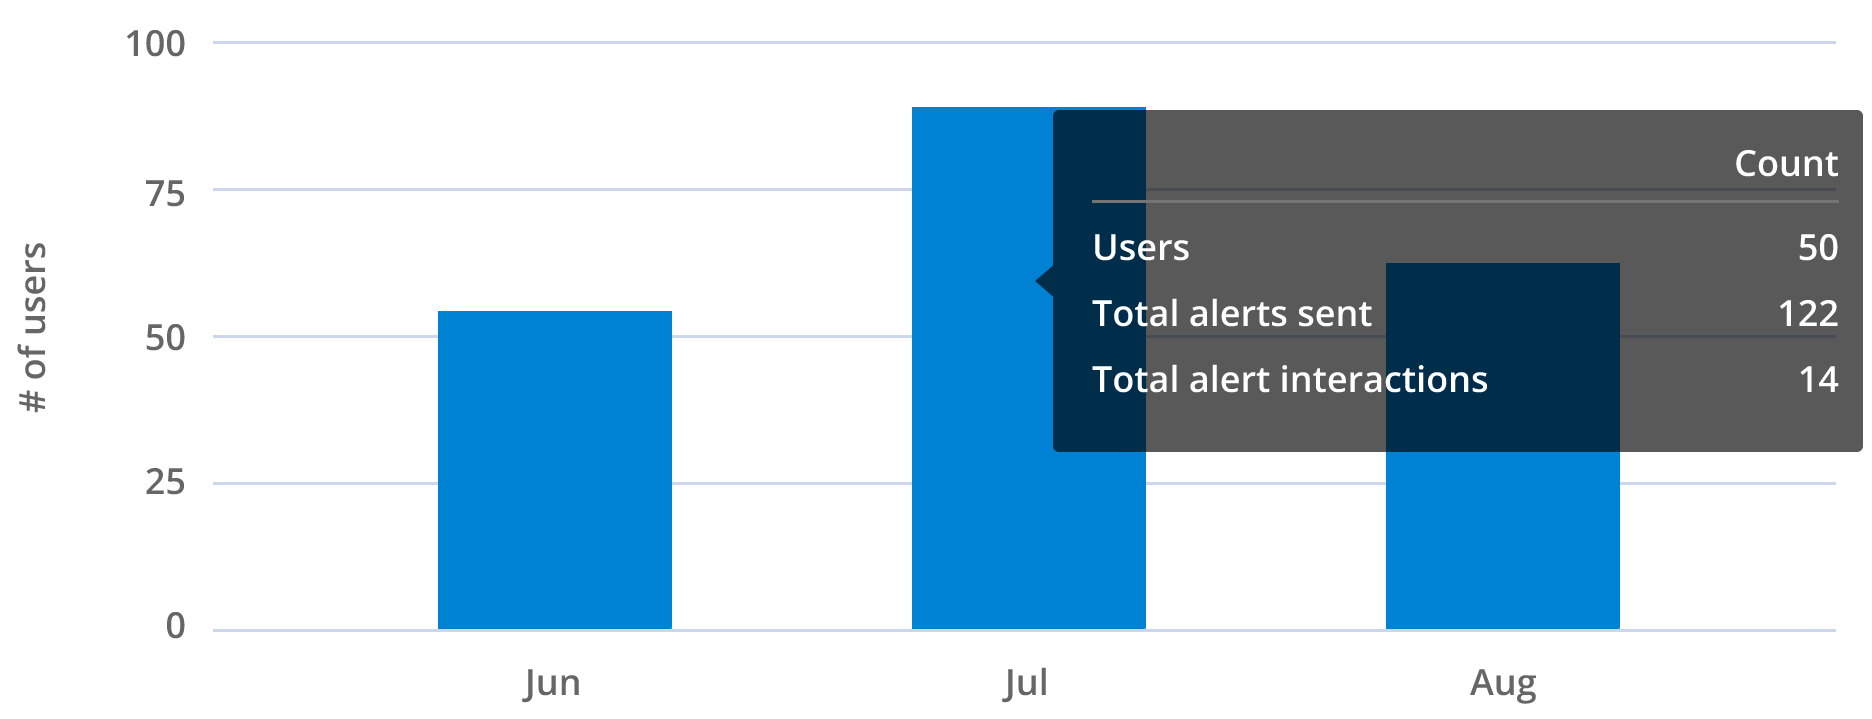
Hover over any bar in the chart to display details including:
Users: Total number of users.
Total alerts sent: The total number of alerts sent.
Total alert interactions: The total number of times users interacted with an alert.
Click on a bar on the chart to open a popup window with more details, including:
User names and emails
User role
User status
Alert channels
Email alerts
Slack alerts
Unique email alert interactions
Unique Slack alert interactions