When pushing substantial amounts of data into Salesforce like for Enrichments or Score exports orchestrations, errors may arise due to multiple APEX triggers running on a particular object. This article is focuses on how utilize Salesforce debug logs to identify the offending APEX triggers that may be causing errors with these orchestrations.
Why you’re here?
You are experiencing higher than expected errors during Score Export orchestrations
You are experiencing longer than expected run time for Score Export orchestrations
6sense provides errors that are available via the Salesforce Bulk APIs. However, these do not tell the full story and can often be misleading. You will need to examine logs from other APEX triggers that are running on the object to identify the issues that are not visible to 6sense.
Step 1: Set debug log filters.
Review the Salesforce Setup Debug Logging guide.
Set the log filters below, see the screenshot for a reference. Warning: you can choose to log at a finer level, but this may put you over the 20MB limit for the debug file.
Apex code - Error
Apex profiling - Fine
System - Info
Database - Info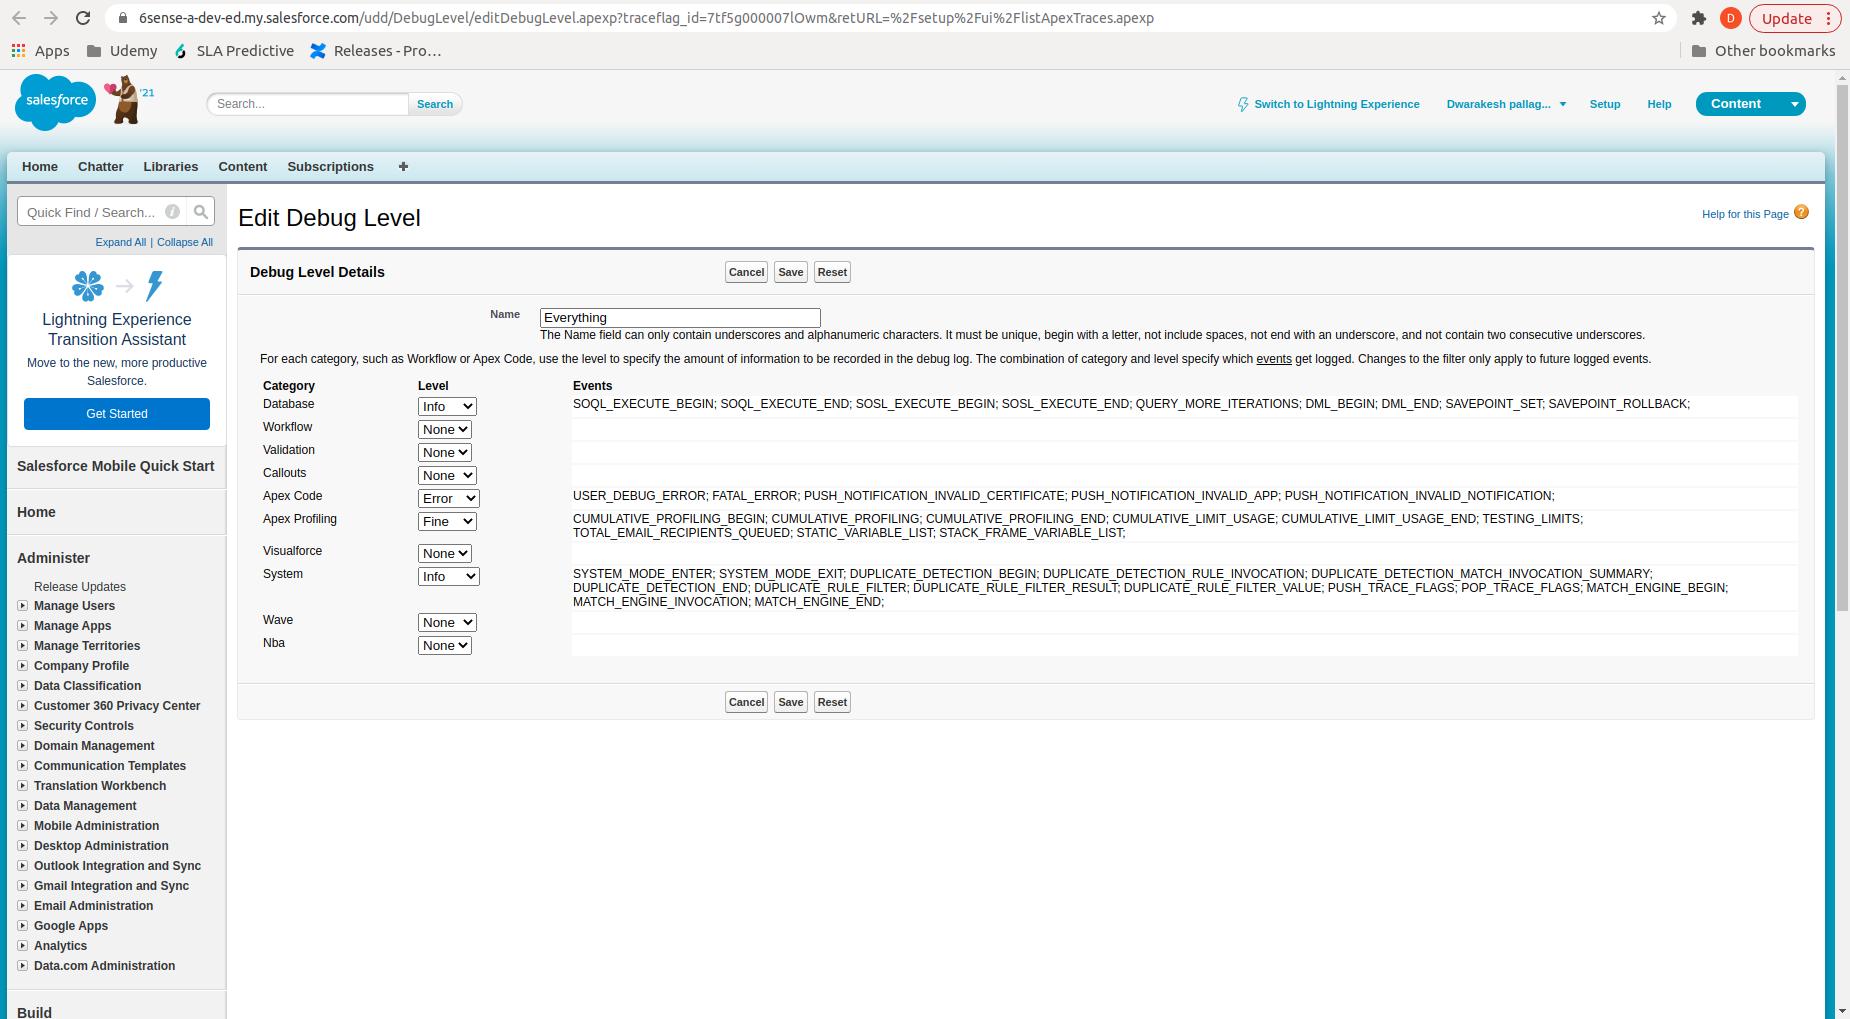
Step 2. Enable debug logs when you are ready to run the Score Export
Look to run the debug logs for the duration of the export. If you have a large number of records to write to, you may hit storage limits for debug logs before the export is completed in its entirety. This will cause additional debug logs to not be captured.
Step 3. View debug logs
Review the Salesforce View Debug Log guide.
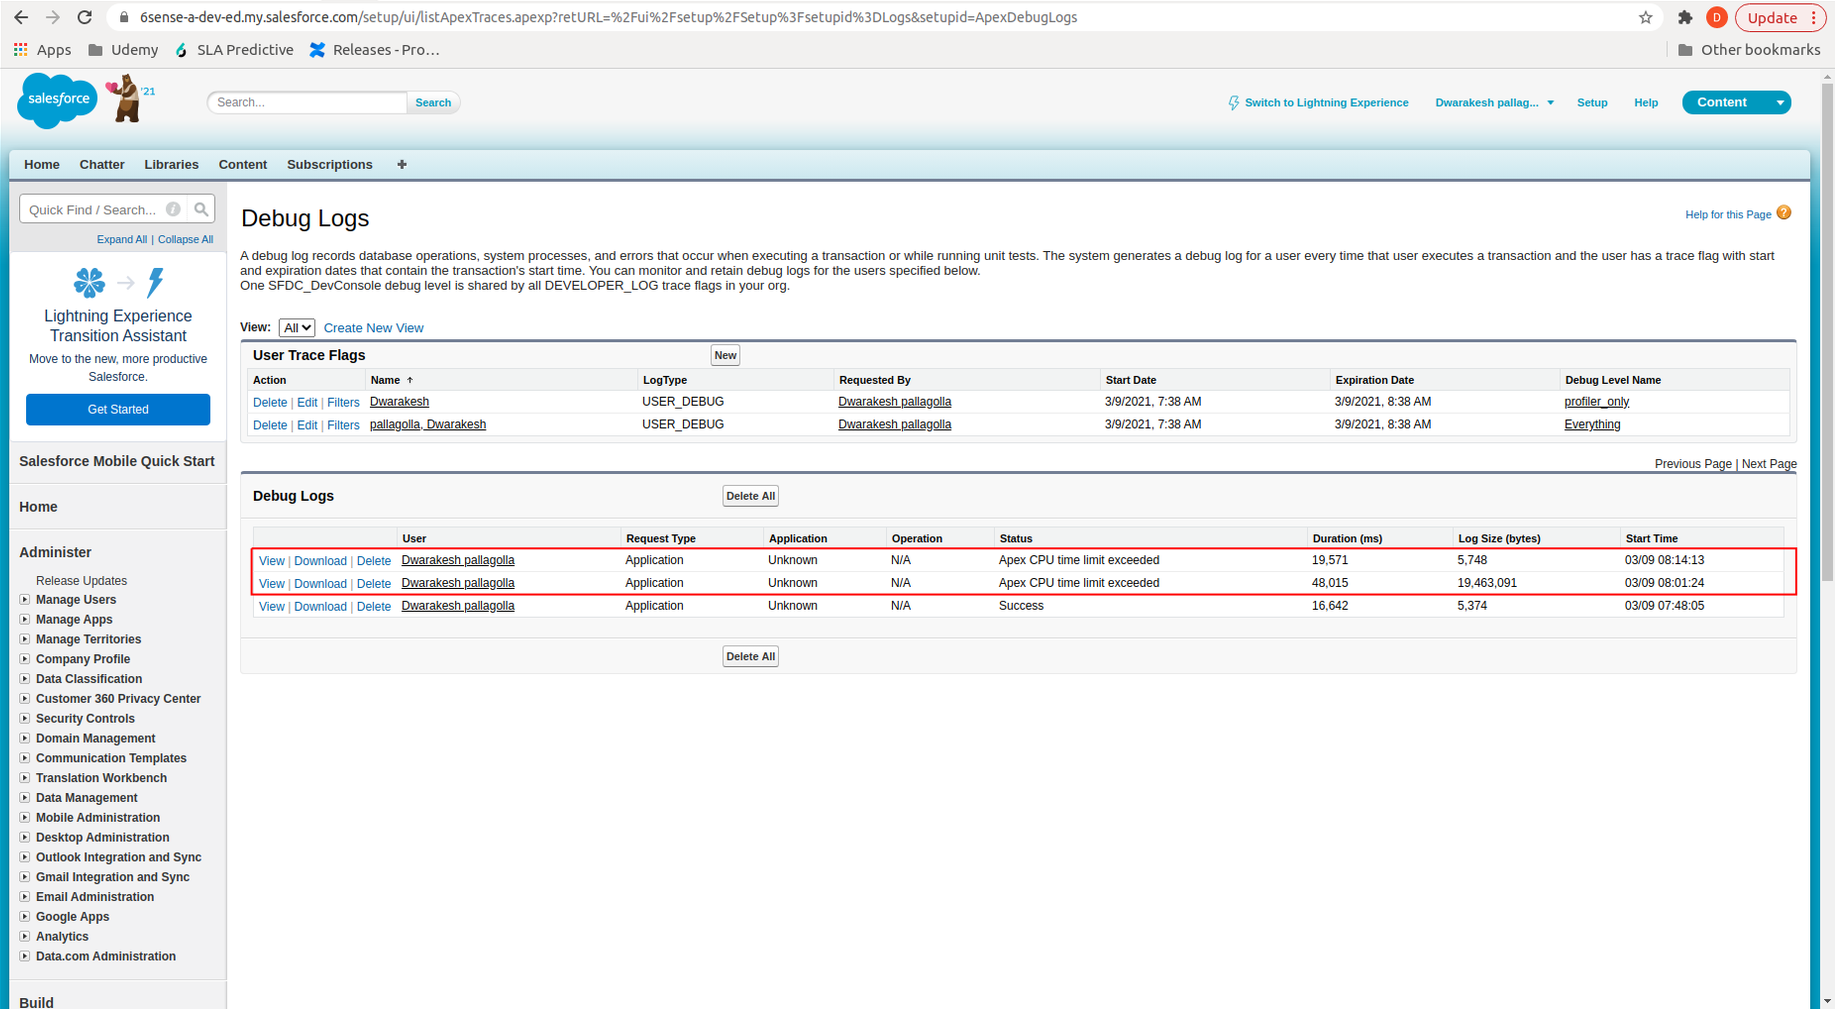
Logs for failed exports will be shown on the Debug Logs page as pictured below. In this scenario we see error status “APEX CPU time limit exceeded” by simulating a particularly expensive trigger on a lead object during a score export Orchestration.
Step 4: Download the logs and review
Below is a sample snippet from a log file that shows the simulated error of a CPU timeout. This part of the log will show when you enable Apex profiling in the trace flags. The full log is attached to this guide.
Note that the (default) namespace in this case means it is a trigger on the parent org. In practice, this could be the namespace of a managed service, and would be found in a separate log file.
In this scenario, the Maximum CPU time: 15063 identifies this as the point of failure as it exceeds the limit of 10000.
Trigger.TestLeadTrigger: line 7, column 1
08:14:32.352 (19352756933)|CUMULATIVE_LIMIT_USAGE
08:14:32.352 (19352756933)|LIMIT_USAGE_FOR_NS|(default)|
Number of SOQL queries: 0 out of 100
Number of query rows: 0 out of 50000
Number of SOSL queries: 0 out of 20
Number of DML statements: 0 out of 150
Number of Publish Immediate DML: 0 out of 150
Number of DML rows: 0 out of 10000
Maximum CPU time: 15063 out of 10000 ******* CLOSE TO LIMIT
Maximum heap size: 1350 out of 6000000
Number of callouts: 0 out of 100
Number of Email Invocations: 0 out of 10
Number of future calls: 0 out of 50
Number of queueable jobs added to the queue: 0 out of 50
Number of Mobile Apex push calls: 0 out of 10
Additional Tips and Resources
Repeat the process above to look at failures for each trigger that is running on the object.
The Apex code log category also gives some additional information like trigger start/end time. In the case of a managed package, these will be hidden.
The DB operations performed by a managed package will be visible in the logs.
Review the Salesforce Debugging Apex: Debug Log guide.