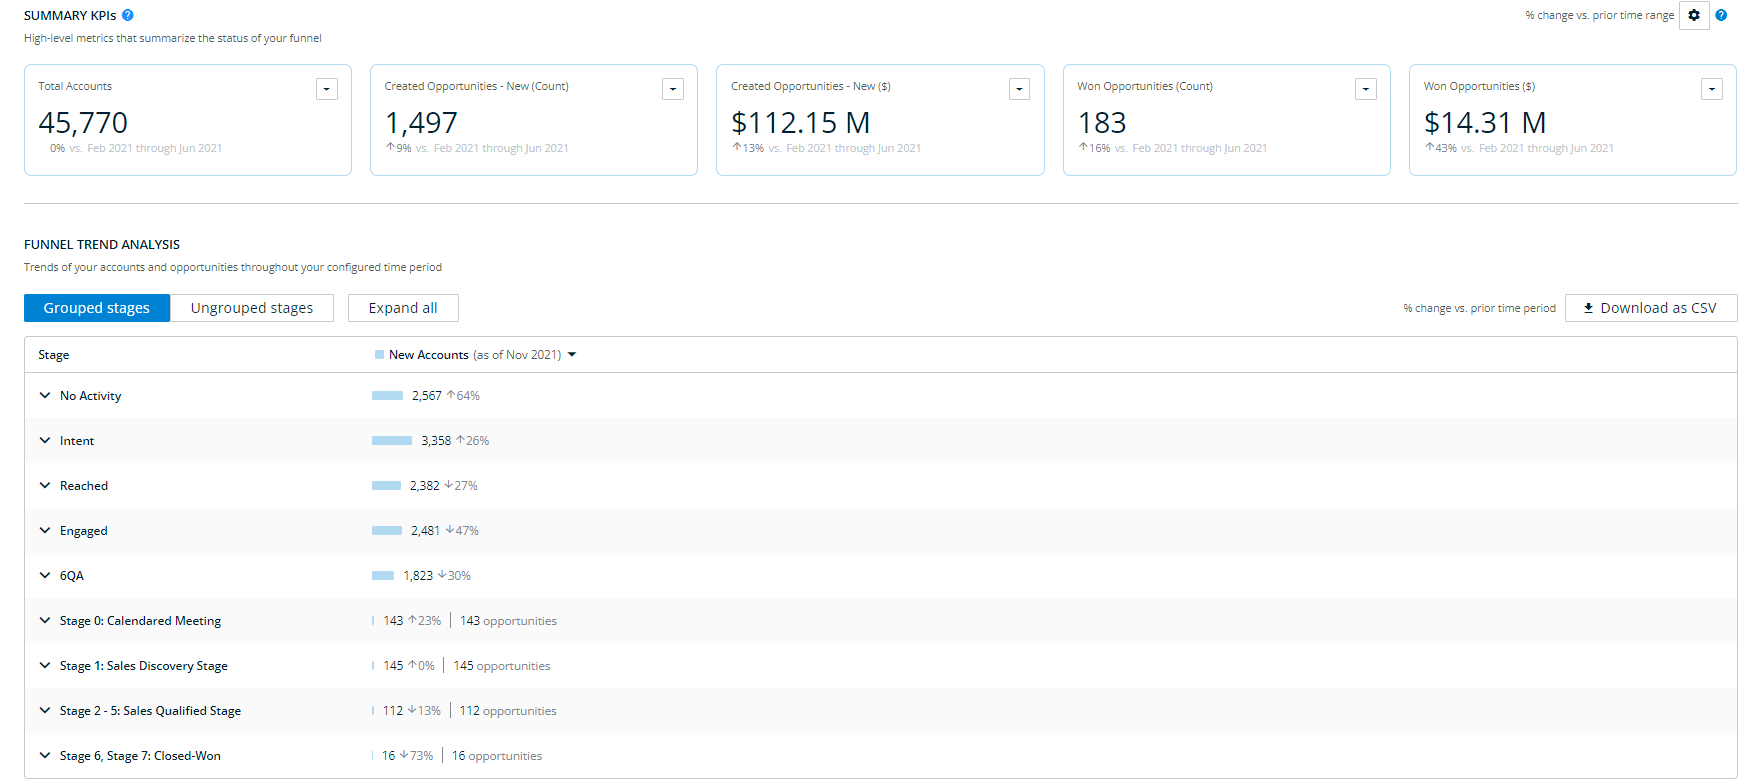
After configuring your report, you will see the report look something like this:
Note:
If there are opportunities in a stage in your CRM that are not appearing in the Funnel Insights report, this is usually due to those opportunities transitioning from the given state to a closed-lost or won state within the given time period.
If there are multiple records for the opportunity stage history, the report will use the last modified record.
Summary KPIs
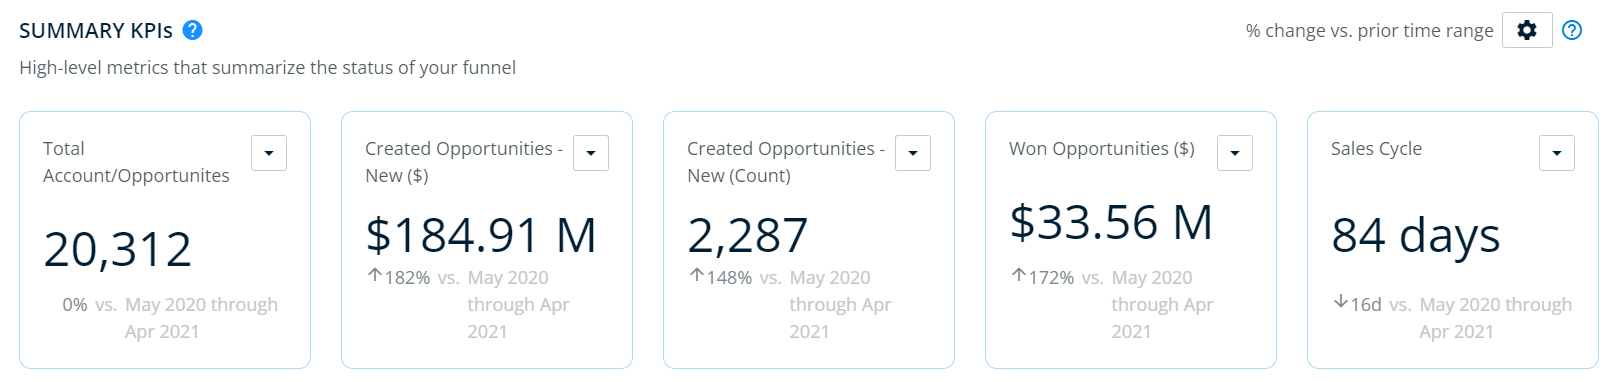
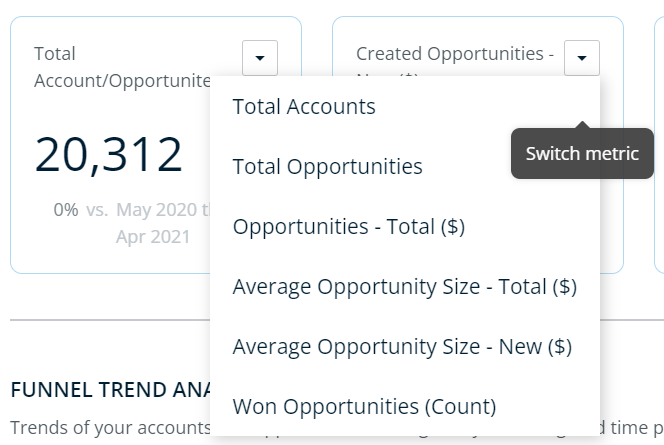
At the top of the report, users will be able to view key summary statistics about their revenue pipeline given the time range and GTM segment(s) selected. Users can select up to five of the following metrics to be visualized, each describing the entire time range selected. You can switch between these metrics by clicking the arrow drop down in the metric box and selecting the metric you want to view instead.
Metric Name | Requirement | Description | Default Selections |
|---|---|---|---|
Total Account/Opportunities Default | None | Accounts/opportunities within the segment(s) at any point in the time range. | Yes |
Total Accounts | None | Accounts within the segment(s) at any point in the time range. | Yes |
Total Opportunities | CRM integration | Number of opportunities in the segment at any point within the time range. | No |
Opportunities – Total ($) | CRM integration | Value of opportunities in the segment at any point within the time range. | No |
Average Opportunity Size – Total ($) | CRM integration | Average value of open opportunities within the time range. | No |
Average Opportunity Size – New ($) | CRM integration | Average value of opportunities created within the time range. | Yes |
Won Opportunities (Count) | CRM integration | Opportunities won within the time range. | No |
Created Opportunities – New ($) Default | CRM integration | Total value of opportunities created within the time range. | Yes |
Created Opportunities – New (Count) Default | CRM integration | Opportunities that were created within the time range. | Yes |
Won Opportunities ($) Default | CRM integration | Total value of opportunities won within the time range. | Yes |
Sales Cycle Default | CRM integration | Average number of days for created opportunities to transition to closed-won within the time range. | No |
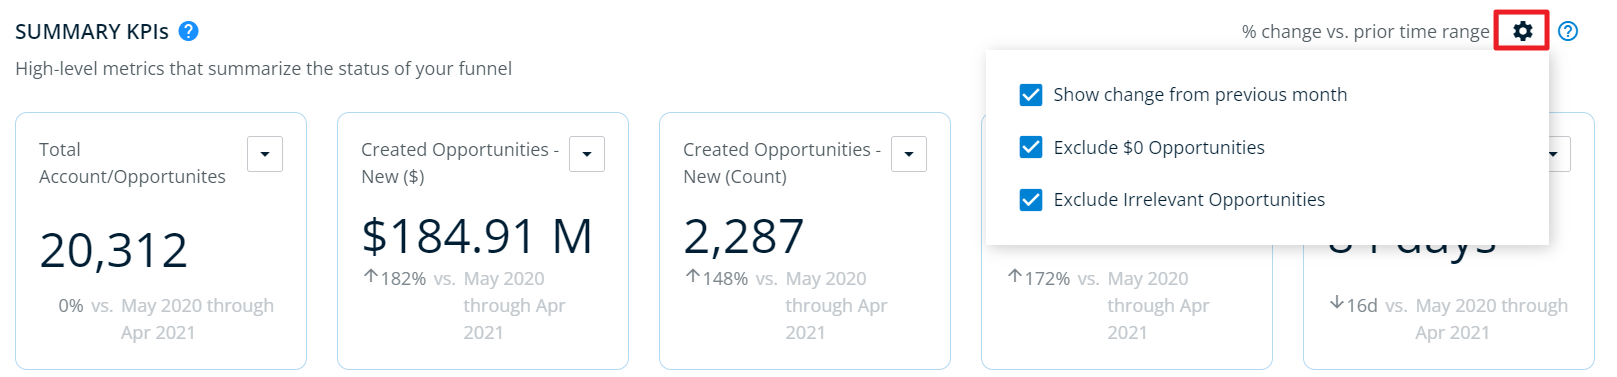
Settings
At the top of the report on the right, click the settings icon to change how the data in the report is calculated. You can choose to show the change from the previous month, hide $0 opportunities, or hide irrelevant opportunities from the report.
Funnel Trend Analysis
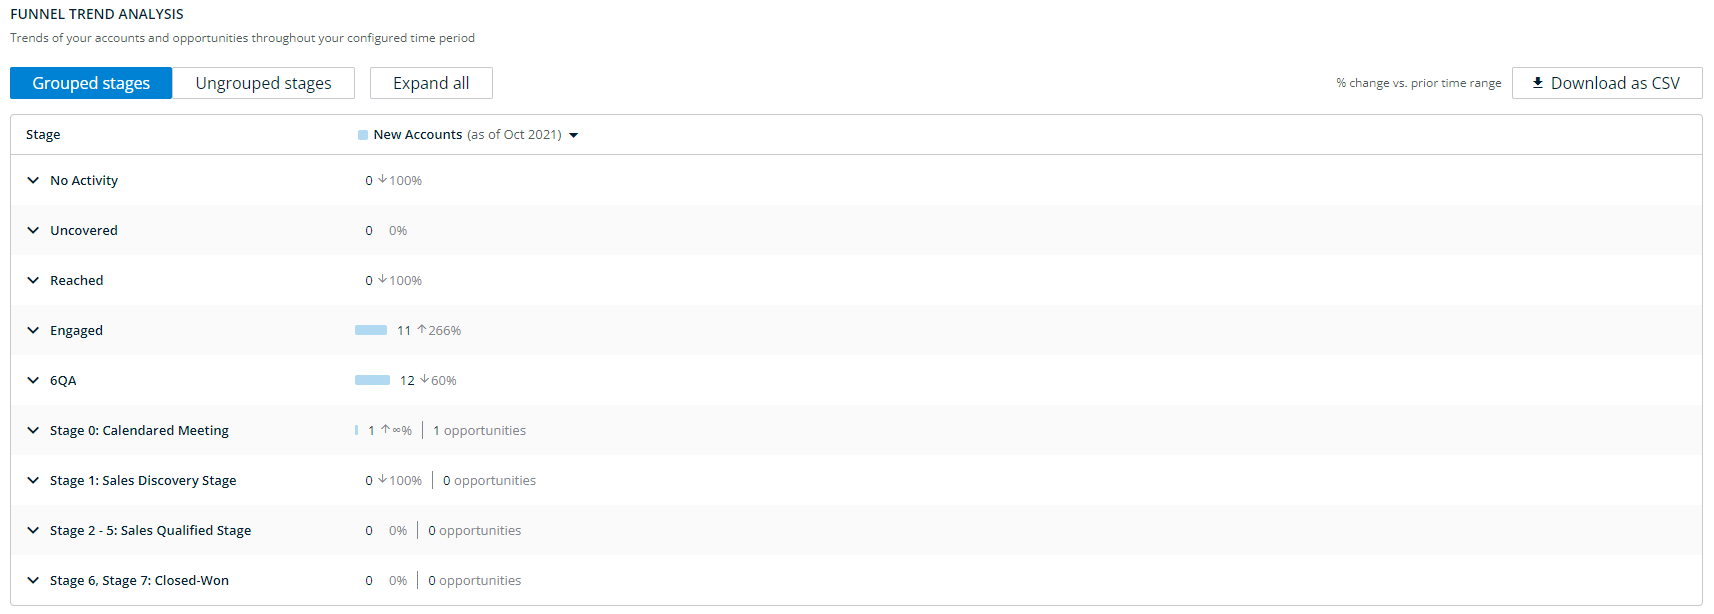
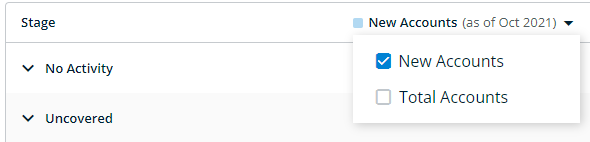
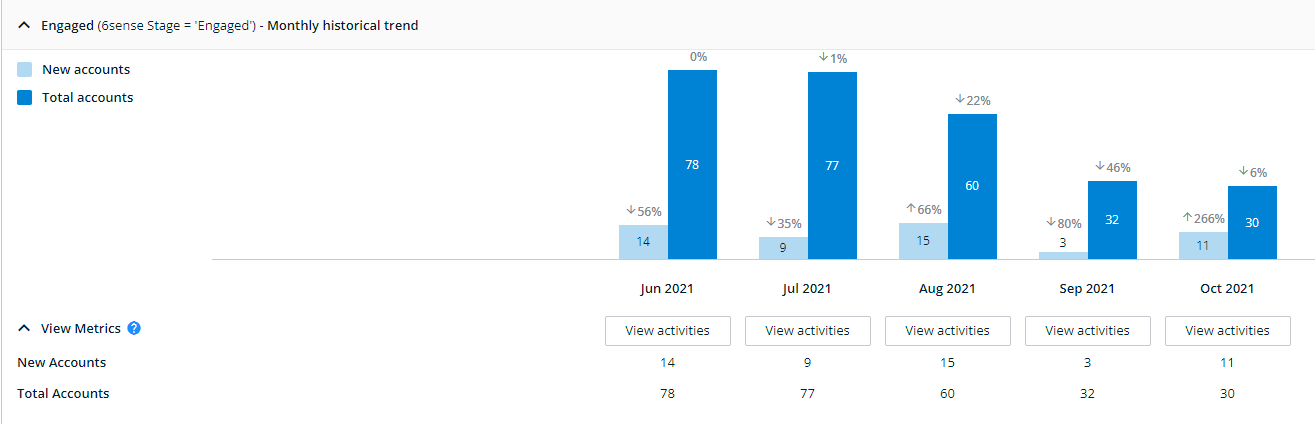
You can select either New Accounts, Total Accounts, or both from the dropdown at the top of the table. If you select both, there will be two bars in the graphs displayed below, to compare New vs Total accounts.
Within the body of the report, the number of accounts and opportunities within each 6sense-based stage and CRM-based stages are summarized.
6sense-Based Stages: The number of accounts/opportunities in that stage within the last time period given the granularity selected. The number of accounts is calculated as follows:
Accounts with no opportunities = contribute +1 to the count.
Accounts with one opportunity that is not mapped = contribute +1 to the count.
Accounts with N opportunities that are not mapped = contribute +N to the count.
CRM-Based Stages: The number of accounts/opportunities in that stage on the last date of the time period. Note that these stages do not include the entire time period, as in the 6sense-Based Stages, only the last date of the period.
Within each stage, comparative percentages are also included that are calculated by comparing the last period within the selected date range to the second to last time period.
The 6sense-Based Stages are defined as follows:
No Activity: Accounts with no intent, marketing, or sales activities.
Intent: Accounts expressing intent by researching your configured keywords, that have not been reached or engaged by marketing or sales activities.
Reached: Accounts that have been reached by email or campaigns, but not engaged by marketing or sales activities.
Engaged: Accounts that have been engaged by marketing or sales activities, such as visiting your website or events, or engaging with your campaigns.
6QA: Accounts that have met your 6sense Qualified Account threshold.
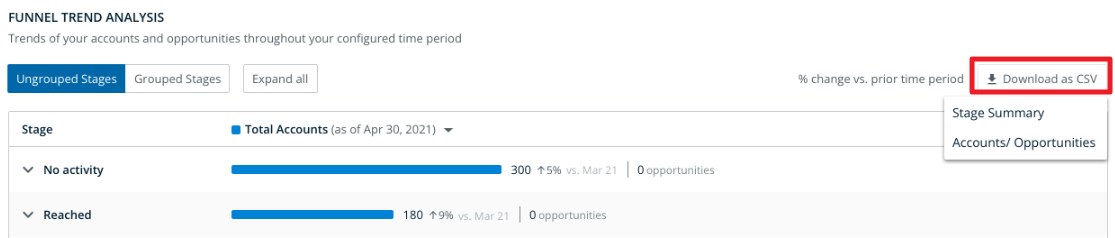
Bulk export all opportunities and accounts from the most recent time period from the main page as a .CSV file by clicking the Download as CSV button and selecting either Stage Summary or Accounts/Opportunities.
Stage Configuration
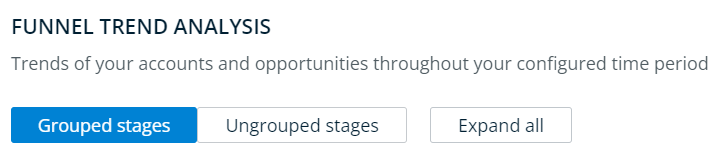
Admins can group stages into buckets. Ungrouped stages would appear under the Ungrouped stages selector, and Grouped stages buckets would appear under the Grouped stages selector.
Only Primary Administrators, Administrators, and Operations Users can configure groupings, but configuration persists for all users. The following section explains this process in detail: Stage Configuration.
Trended Graphs
For each time period (determined by granularity and time range selected), the following trended data is provided when you click into the stage by clicking the arrow drop down beside the stage name.
Note: All data is based on account-opportunity pairs.
From any account list visualization element (bar graph, summary statistic, etc.) on the primary report screen, users can click on View activities to see the list of activities that were enabled. This will appear the same as in the Segment Performance Report.
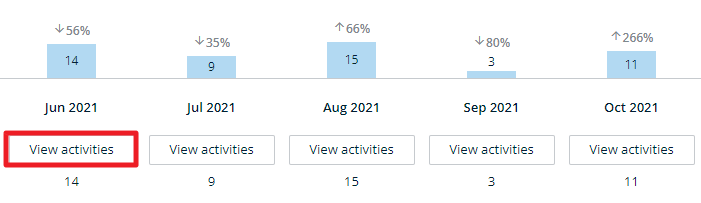
Click on any bar in the graph to see the list of accounts represented in that bar. If you are viewing New Accounts in the report, only new accounts will be shown in the list. If you are viewing Total Accounts, you will see all accounts.
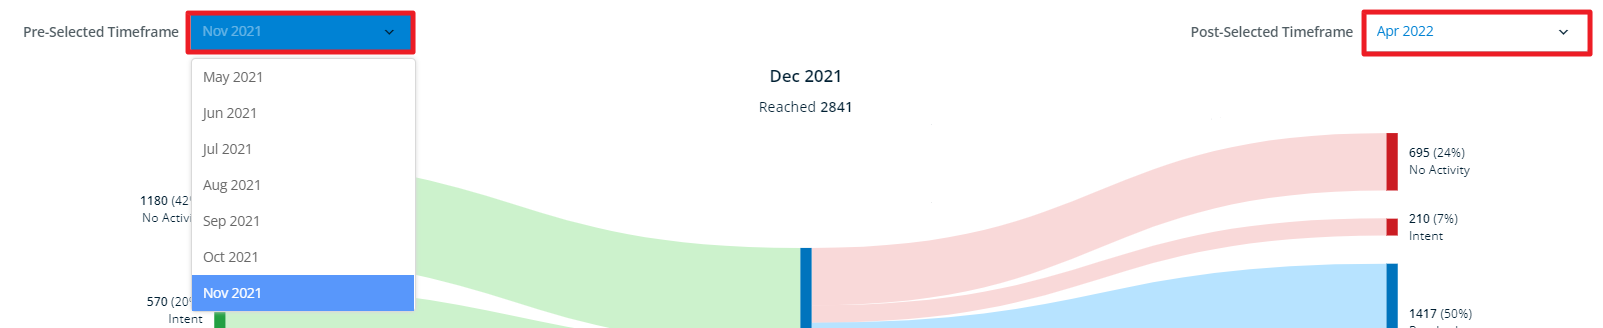
This chart enables you to more closely measure and monitor potential bottlenecks throughout your funnel.
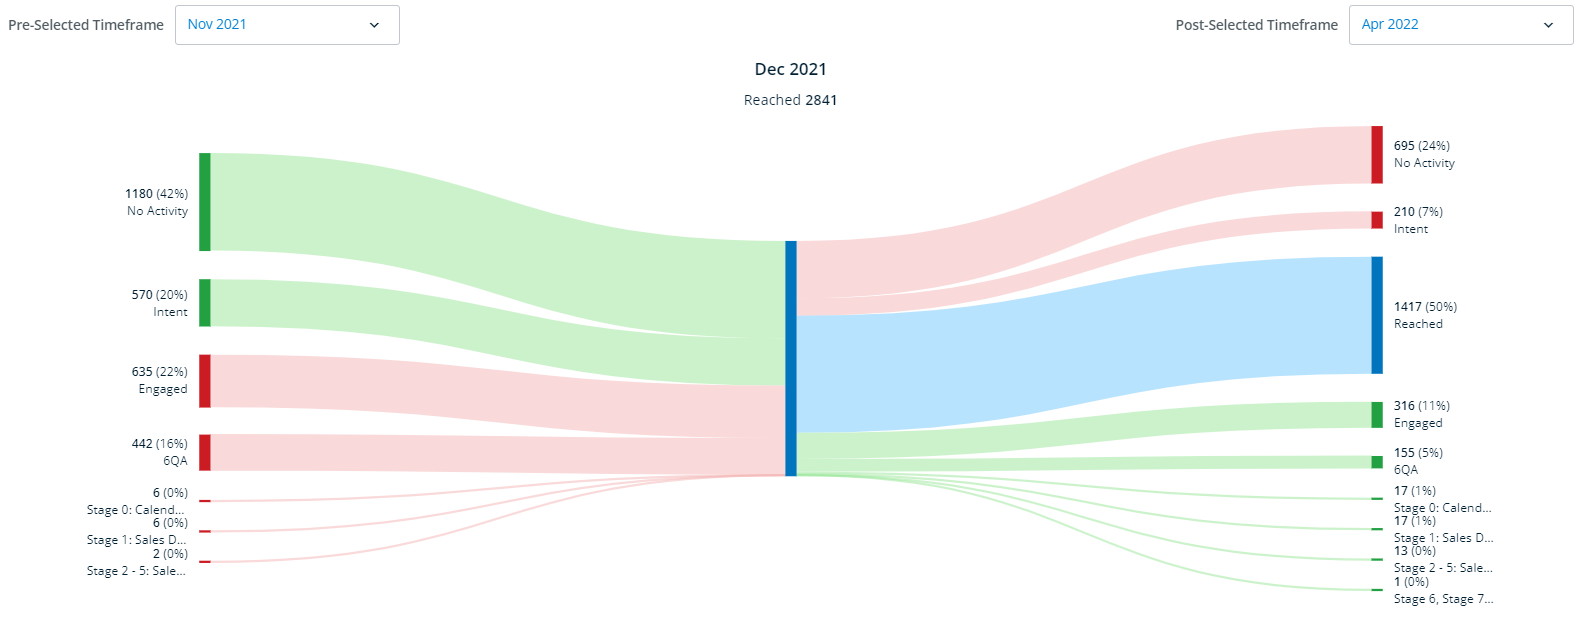
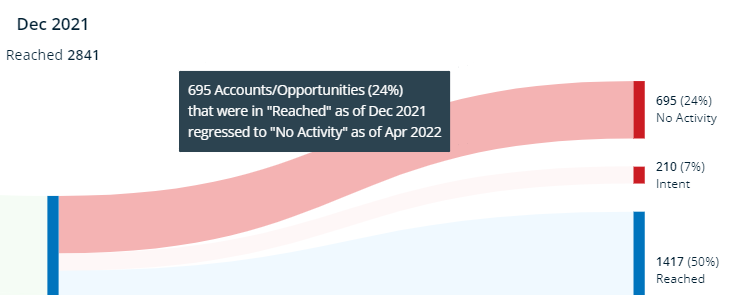
Hover over stages in the flow to see more details of the stage movement.
The pre- and post-selected timeframes can be adjusted by clicking the dropdowns.
Below the chart the accounts in this cohort are listed as a table. Sort by any of the metrics in the top row by clicking the arrows beside them.
Stage Metrics
Metric | Definition | 6sense-Based Stages (No Activity, Reached, Engaged) | 6QA-Based Stages | CRM-Based Stages |
|---|---|---|---|---|
New Accounts (appears as Accounts/Opportunities in 6sense-Based stages) | Account-opportunity pairs that entered the stage within the time period. | Yes | Yes | Yes |
Opportunities – New (Count) | Number of opportunities that entered the stage within the time period. | No | No | Yes |
Opportunities – New ($) | Total value of opportunities that entered the stage within the time period. | No | No | Yes |
Total Accounts (appears as Accounts/Opportunities in 6sense-Based stages) | Account-opportunity pairs in the stage at the end of the time period. | Yes | Yes | Yes |
Opportunities – Total (Count) | Number of opportunities in the stage at the end of the time period. | No | No | Yes |
Opportunities – Total ($) | Total value of opportunities in the stage at the end of the time period. | No | No | Yes |
Average Opportunity Size ($) | Average value of opportunities in the stage at the end of the time period. | No | No | Yes |
Sales Cycle | Average number of days for opportunities in the stage to transition to a more advanced stage. | No | Yes | Yes |