Segment performance reports, Buying Stages and Engagement, provide you with insights to understand how accounts move through buying stages or stages of engagement. They help you understand the effects of your marketing and sales tactics that use 6sense segments.
Use segment performance reports to conduct retrospectives on successful cohorts, adjust marketing and sales strategies, and identify opportunities to create more effective campaigns and segmentation schemes.
Each month’s Segment Performance Report data is available on the 3rd of the following month, at 12:00 AM UTC. Weekly report data is available Mondays.
All ABM users in 6sense can view the report. SI users must be Primary or Sales Administrators to view the report; Sales SDR and AE users cannot access the report.
You can access segment performance reports from the ABM > Reports menu.
The types of segment performance reports include:
Buying Stages analysis report: Helps you understand the transition of accounts between 6sense-provided predictive buying stages: Target, Awareness, Consideration, Decision, and Purchase. This report requires the 6sense Predictive add-on.
Engagement report: Helps you understand the level of engagement across various account states throughout your marketing and sales pipeline, from “no intent” to opportunities won.
Report contents
Based on your 6sense environment, features in the segment performance report are either available or disabled:
Revenue Marketing with no CRM integration: Engagement report with limited channels of connected data visualized, and no opportunity pipeline or revenue.
Revenue Marketing with CRM integration: Required for engagement reporting with limited channels of connected data visualized, along with a view of influenced opportunity pipeline and revenue.
Predictive add-on with CRM or MAP channel integrations: Required for buying stage and engagement reporting with all channels per data mappings completed for product categories, along with a view of influenced opportunity pipeline and revenue.
Retargeting campaigns are not included in segment performance reports.
Set up a Segment Performance report
To set up a Segment Performance report:
Go to ABM > Reports.
Select either Buying Stages or Engagement. The report’s setup popup opens.
Enter the details required to set up the report, as described in the next section.
Select Apply.
Segment Performance report settings

The annotations in the screenshot refer to the following settings:
1 – Product Category
Select the specific product category (Predictive model) on which to base the report.
2 – Segments
Use the Search function to select one or more segments to use for analyzing changes in performance. Select a segment that was created prior to the end of the analysis timeframe that contains <100,000 accounts.
If you include multiple segments in the report, the report will be generated based on accounts that were in any of the selected segments.
Best Practice: Typical segments that are worth analyzing in a segment performance report are those that expect to have accounts distributed across buying stages and engagement states, so that you can observe changes.
3 – Comparison timeframes
Performance reports provide a way to understand impact by comparing a historical timeframe with another similar historical timeframe. You can see relevant trend insights that help you understand and evaluat performance, enabling flexible month-to-month or quarter-to-quarter analyses.
One Month to Another: Compares a calendar month to another calendar month. You can analyze the most recent completed month and compare it to the previous month. Default timeframe selections include:
Baseline Timeframe: (Default) 2 calendar months ago. The timeframe to be to compared against. Must be prior to the analysis timeframe.
Analysis Timeframe: (Default) 1 calendar month ago. The timeframe to analyze.
A Range of Months to Another Range: Compares two longer timeframes, as aligned to sales and marketing programs or internal reporting initiatives. You can analyze quarter-over-quarter timeframes and associated performance. Default timeframe selections:
Baseline Timeframe: (Default) 4-6 calendar months ago (2 quarters). The timeframe to be to compared against. Must be prior to the analysis timeframe.
Analysis Timeframe: (Default) 1-3 calendar months (last quarter). The timeframe to analyze.
4 – Cohort options
The cohort options determine the data available within the report.
As most segments have some dynamic nature due to behavioral filters, other qualifier filters, or changes in account matching over time with 6sense improvements, you must select between one of the provided options to define a static cohort to analyze. For example, you can select accounts that were in the segment during the analysis timeframe, or baseline timeframe.
Accounts in the Segments AS OF TODAY: Any date range can be selected.
All accounts in the Segments during the BASELINE TIMEFRAME: The segment must have been created prior to the baseline timeframe.
All accounts in the Segments during the ANALYSIS TIMEFRAME: The segment must have been created prior to the analysis timeframe.
5 – Analysis type
You can select between the report type you want, either Buying Stage or Engagement.
6 – Opportunity reporting
Exclude $0 opportunities: Removes opportunities whose values are either blank or set at $0. This helps to get the most accurate number of active opportunities.
Exclude irrelevant opportunities: Removes opportunities that aren’t relevant. Refer to Relevant Opportunity Definition.
Interprete a Segment Performance report
After you set up a report, you can view the results.
Each month’s Segment Performance report data is available on the 3rd of the following month, at 12:00 AM UTC. Weekly report data is available Mondays.
Summary statistics
For each report type (buying stage or engagement), the segment performance report displays summary statistics that provide a snapshot of the changes within your segment during the selected timeframe.
Here is an example Buying Stage analysis summary:

Here is an example Engagement analysis summary:

The summaries include the following information:
Total Accounts: The total number of accounts analyzed based on the report’s cohort configuration.
Increased Buying Stage/Increase in Engaged Accounts: The number of accounts that increased their buying stage or engagement in the analysis timeframe, as compared to the baseline timeframe.
New Pipeline (USD): The new pipeline created in the analysis timeframe among the total accounts. Only opportunity data where the currency is US Dollars or undefined, as determined by your CRM to 6sense mappings, are included in this summary. This data includes Microsoft Dynamics or Hubspot.
Total Won (USD): The new revenue associated with opportunities closed-won in the analysis timeframe. Only opportunity data where the currency is US Dollar(s) or undefined, as determined by your CRM to 6sense mappings, are included in this summary. This data includes Microsoft Dynamics or HubSpot.
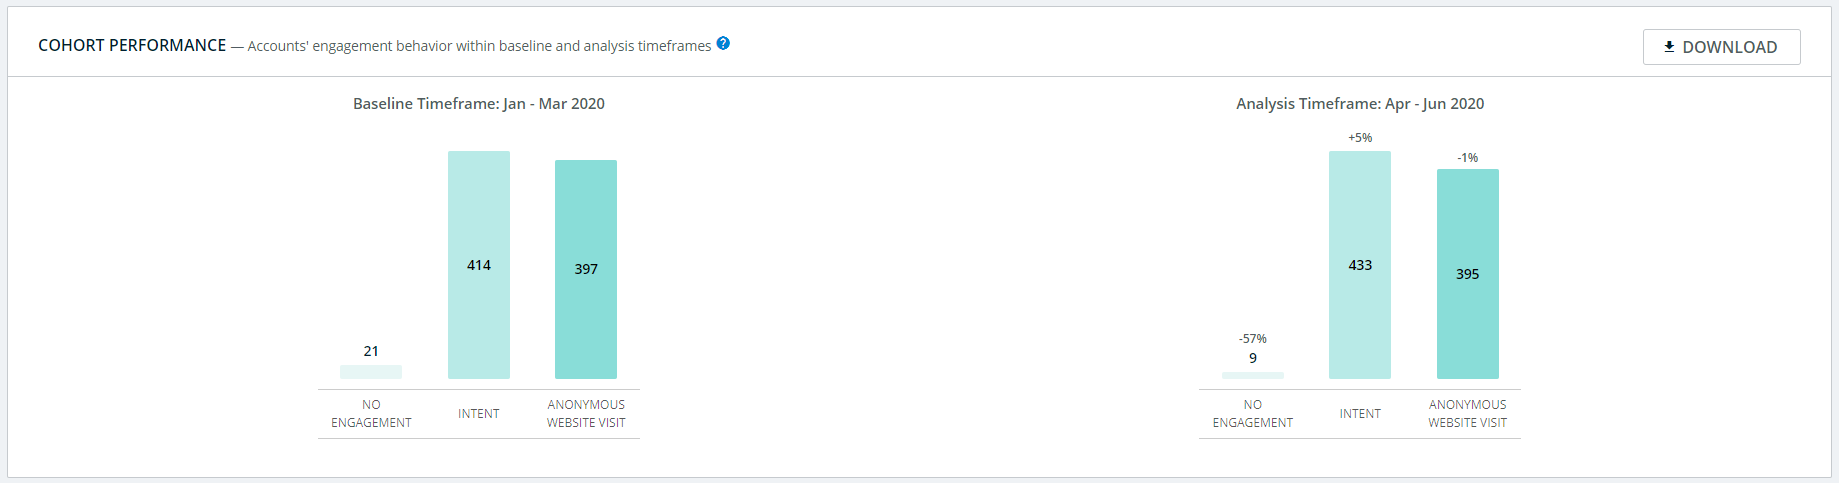
Cohort performance
Each segment performance report shows the distribution of the cohort of accounts by Buying Stage and Engagement as applicable in the baseline timeframe and the analysis timeframe. This data does not include Microsoft Dynamics or HubSpot.
Buying stage
The buying stage shown is the highest buying stage reached by an account in the given timeframe, with Purchase being the highest and Target being the lowest. Accounts are mutually exclusive between buying stages in a given timeframe.
Below each buying stage bar is a summary of the New Pipeline (USD) and Total Won (USD) associated with the accounts in each buying stage.
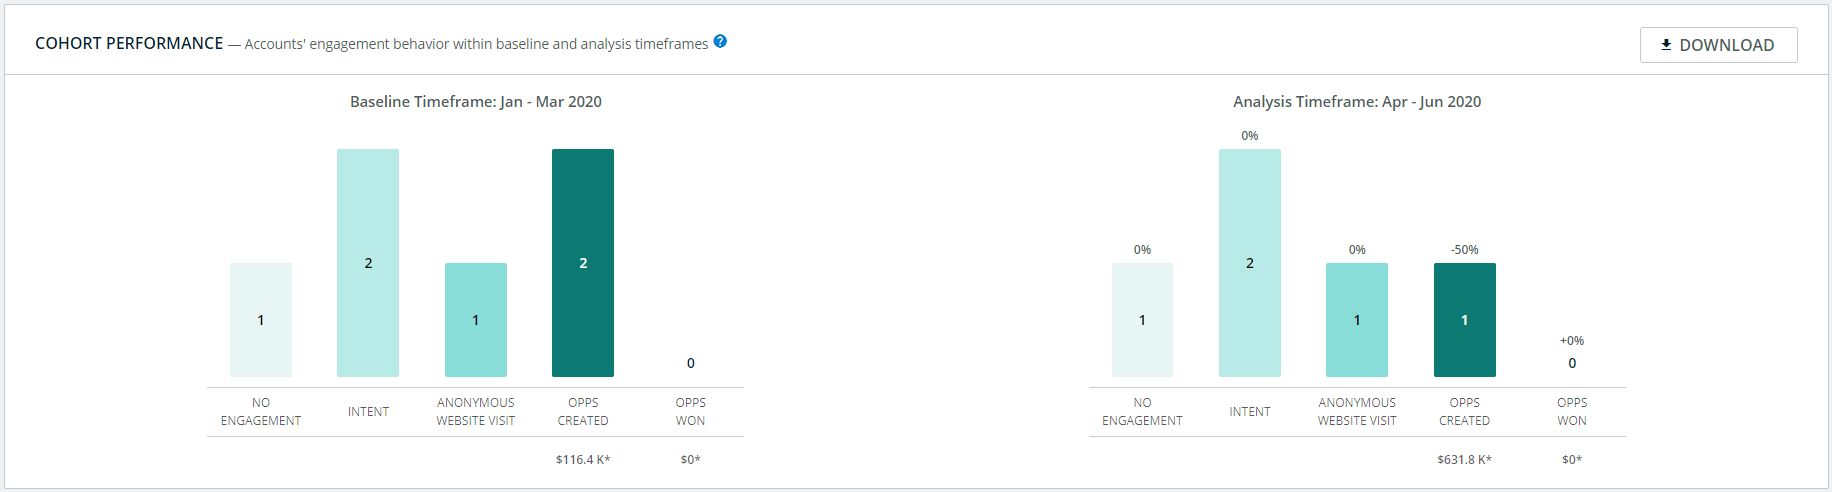
Here is an example of Cohort Performance:

Engagement
Engagement states consider whether an account has met the criteria for each state in the given timeframe. Accounts are not mutually exclusive between these states and are counted within each state that are applicable in the given timeframe.
Below the Opps Created bar is a summary of the New Pipeline (USD) associated with the accounts that had an opportunity created in the selected time range; below the Opps Won bar is a summary of the Total Won (USD) associated with the accounts with a won opportunity in the selected time range.
The specific actions that the employees at an account need to take to be considered engaged with MAP or CRM campaigns is dependent on the mapping.
All engagement data is exclusively tied to Predictive model taxonomy mappings. For example, for No Engagement, 6sense looks at the activity rules configured for the MAP or CRM for the specific model category (product).
The following are the engagement states shown in this analysis:
Engagement State | Activity | Definition | Data Source |
|---|---|---|---|
No Engagement | None | Account shows no engagement on configured keywords, anonymous activity, or known activity. | 6sense, MAP (if integrated), CRM (if integrated) |
Intent | Keyword Research | Account is researching one or many configured keywords. Researching any number of keywords shows intent. | Your configured keywords via 6sense, Bombora, or TrustRadius |
Anonymous Website Visit | Website pageviews | One or more of the account’s employees are engaging anonymously on the website. | Your website activity via 6sense identity |
Known Engagement | Activities within MAP and CRM campaigns, events, and tasks. | One or more of the account’s employees are engaging with your sales and marketing tactics. | Your CRM and MAP Campaigns, Events, and Tasks |
Opportunities Opened | A new opportunity is created. | Account has a new opportunity created. | Opportunity data in your CRM |
Opportunities Won | An opportunity is closed won. | Account has an opportunity won. | Opportunity data in your CRM |
Cohort performance chart, Predictive, and CRM integration
The Cohort performance charts display different bars depending on your 6sense setup and integrations.
Here is an example Cohort Performance chart for a 6sense environment with an integrated CRM and the Predictive add-on:

For environments with no CRM integration, here is an example Cohort Performance chart:
For environments with CRM integration, here is an example Cohort Performance chart:
Cohort movement
Cohort movement applies to the Predictive buying stage analysis.
Cohort movement helps you understand the nature of the movement of accounts within the Predictive buying stages that are mutually exclusive. Each cell in the grid shows how many accounts moved from one highest buying stage (in the baseline timeframe) to a same or different highest buying stage (in the analysis timeframe).
Here is an example Cohort movement for one product category:

Review activities by source
The Activities by source section contains data about the activities that the accounts within the segment performed, were reached by, or were engaged with. Select an individual listing to get more details.
Data shown here are dependent upon your subscription and integrated data sources. Each account, and their associated pipeline and revenue, appear under each activity that they interacted with.
Changes in percentage represent changes in the accounts influenced per activity source category.
The Activities by source information is also available in the Funnel Insights Report.

Select a button at the top left of the chart to toggle between Activity type or Team views.

Note: Retargeting campaigns are not included in segment performance reports.
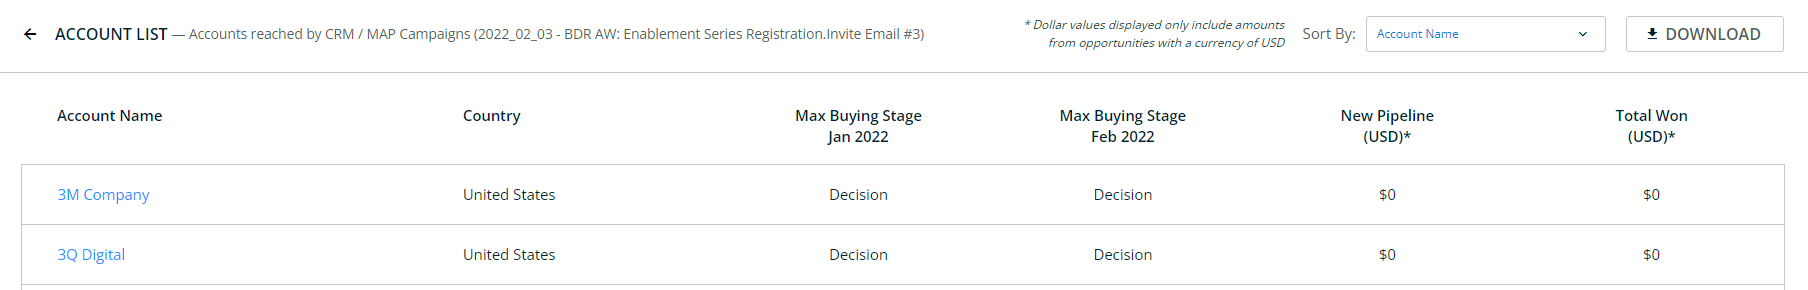
Open detailed lists of accounts from metrics
Select metrics summaries to open filtered lists of accounts for the relevant data.
Intent panel metrics
Intent metrics include:
Intent total: Number of deduplicated accounts that expressed intent across all data sources. Sourced from your configured keywords via 6sense, Bombora, or TrustRadius.
6sense Keyword Research: Accounts researching your configured keywords. Sourced from your configured keywords via 6sense.
Bombora Topics: Accounts researching Bombora surge topics. Displays as greyed out if Bombora is not configured. Sourced from your configured surge topics via Bombora.
G2 Intent: Accounts researching G2 activity descriptions. Sourced from your G2 subscribed activity description.
TrustRadius Intent: Accounts researching TrustRadius activity descriptions. Displays as greyed out if TrustRadius is not integrated. Sourced from your TrustRadius subscribed activity descriptions.
Reach or Marketing reached panel metrics
Reached metrics include:
Reach total: Number of deduplicated accounts reached (served an ad impression) across all data sources. Sourced from all 6sense-connected data sources, including your MAP and CRM.
AI Email Reached: Accounts reached by your 6sense AI Email campaigns.
CRM/MAP Campaigns Reached: Accounts reached by email or other campaigns run through your MAP or CRM. Sourced from your MAP and CRM campaigns.
6sense Campaigns Reached: Accounts reached (served an ad impression) by your 6sense Advertising campaigns. Sourced from 6sense.
External Campaigns Reached: Accounts reached (served an ad impression) by your DSP campaigns. Sourced from your DSP via 6sense identity.
LinkedIn Campaigns Reached: Accounts reached (served an ad impression) by your LinkedIn campaigns. Sourced from LinkedIn.
Engagement or Marketing engaged panel metrics
Engagement metrics include:
Engaged total: Total number of deduplicated accounts engaged, source from all 6sense-connected data sources.
AI Email Engaged: Accounts engaged by your 6sense AI Email campaigns.
CRM/Map Campaigns Engaged: Accounts engaged by email or other campaigns run through your MAP or CRM. Sourced from your MAP and CRM campaigns.
Important: If your CRM is not integrated with 6sense, the metrics New Pipeline Influenced (USD) and Total Won Influenced (USD) are not available. When integrated, both are shown for opportunities where amounts are in US dollar (USD) only.
6sense Campaigns Engaged: Accounts engaging with (clicking through) your 6sense Advertising campaigns. Sourced from 6sense.
External Campaigns Engaged: Accounts engaging with (clicking through) your DSP campaigns. Sourced from your DSP via 6sense integration.
LinkedIn Campaigns Engaged: Accounts engaging with (clicking through) your LinkedIn campaigns. Sourced from LinkedIn.
Anonymous Web Engaged: Accounts visiting your website as identified by 6sense. Sourced by your website activity via 6sense identity.
Known Web Engaged: Accounts visiting your website that your MAP is able to identify. Sourced from your MAP.
Attended Webinars: Accounts that attended your webinars. Sourced from your CRM and MAP.
Attended Trade Shows: Accounts that attended your trade shows. Sourced from your CRM and MAP.
Attended Field Events: Accounts that attended your field events. Sourced from your CRM and MAP.
Sales reached panel metrics
The Sales reached panel links to the following report:
Sales Reached (CRM Activity): Accounts reached by your sales activity as tracked by your CRM (emails, calls, and voicemails). Sourced from your CRM events and tasks.
Sales engaged panel metrics
The Sales engaged panel links to the following report:
Sales Engaged (CRM Activity): Accounts engaging with your sales activity as tracked by your CRM (replying to an email, taking a phone call, etc.) Sourced from your CRM.