The Website Visits report helps you view and analyze website visit activity by accounts over time. It helps answer questions such as:
Which accounts are visiting your site most often?
How deeply are they engaging, and which pages are they viewing?
Which channels (UTMs) are driving the right traffic?
In addition you can download the full data set, including accounts with MID and CRM IDs.
Prerequisites
All ABM users in 6sense can view the report. View-only users cannot download the report.
SI users must be Primary or Sales Administrators to view the report; Sales SDR and AE users cannot access the report.
Access the Website Visits report
To access the report:
Go to ABM > Reports.
Select Website Visits.
Websites Visits dimensions
At the top of the report you can adjust various dimensions that affect every chart in the report.

Dimension: Select the dimension, either:
By time
By account name
By URL
By UTM source
Time dimension: Use the menu to group the time by day, week, month, or quarter.
Scope: Either all accounts in your system or an individual segment.
Product/Predictive model: If you have more than one Predictive model, you can select which one to use.
Report header data and options
The report header shows the total number of accounts and the date range of the report.

The headers include controls to:
Filter the results by:
CRM
In CRM
Not in CRM
Industry
Country
State
City
Buying Stages (requires the Predictive add-on)
Target
Awareness
Consideration
Decision
Purchase
Change the date range, for up to two years. (Two years is our data retention policy.)
Save the report.
Copy a link to the report.
The following section is a Performance chart, then an Activity details table.
Use the filters and menus to adjust the metrics displayed in the report, as described in the following sections.
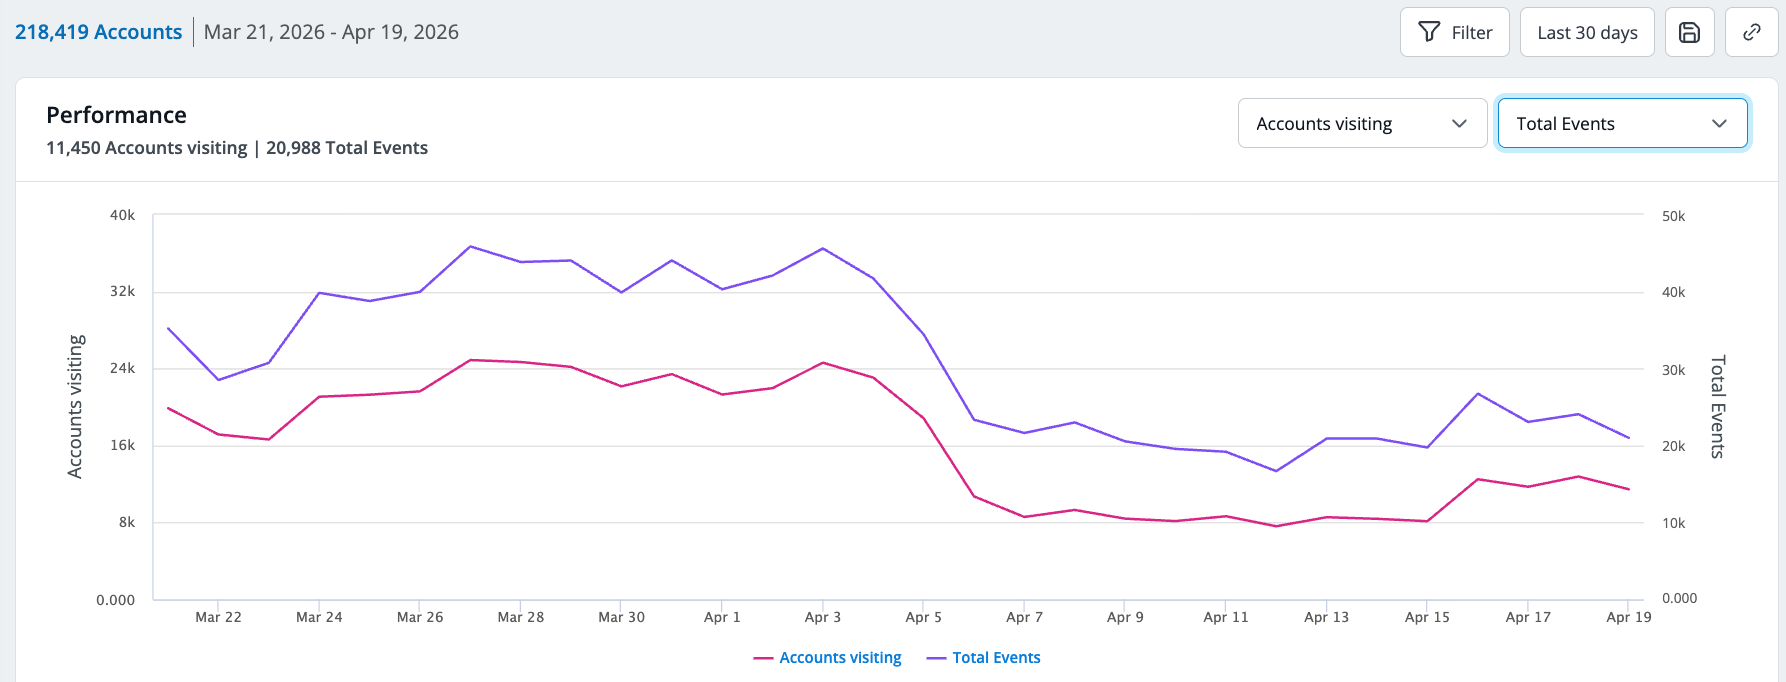
Performance chart over time
When the dimension is time, the Performance chart shows the trend of two metrics over time.
Use the two menus on the right of the Performance chart to review the relationships between two metrics. By default the chart compares accounts visiting versus total events. These metrics are also shown in the Activity details table. Options include (definitions are listed in the next section):
Accounts visiting (default)
Total events (default)
Total sessions
URLs visited
Pages visited
Average events/session
Average pages/session
Return rate
Bounce rate
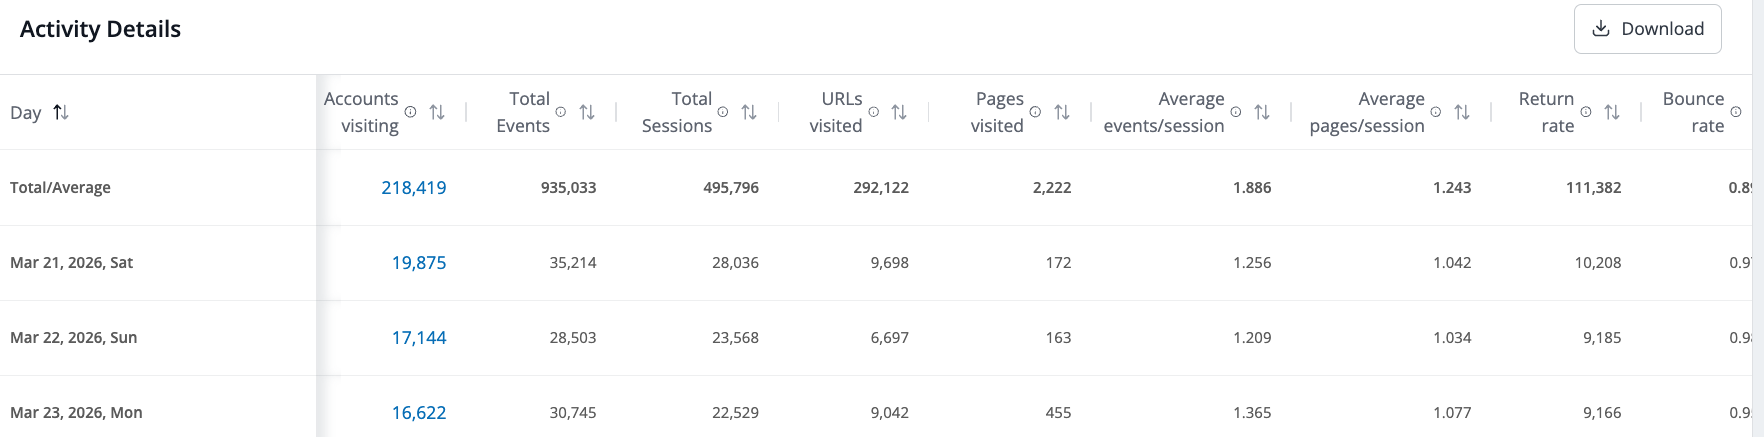
Activity details table
The Activity details table lists metrics on a daily basis, including:
Total number of unique accounts visiting your site. Select a number in this column and row to open the Accounts visiting list.
Total number of events tracked across all sessions
Total number of sessions from all IP addresses
Unique URLs visited (including UTM parameters)
Pages visited across all sessions (excluding UTM parameters)
Average events per session (total events divided by total sessions)
Average page views by an IP address per session
Return rate, the number of IP addresses that visited on more than one day in the time period
Bounce rate, the percentage if IP addresses that visited exactly one URL, versus all IP addresses in the account
Accounts visiting details list
In the Activity details table, select the number in the Accounts visiting column to open the accounts visiting details list. It shows:
Total number of accounts visited
Account: Select the link in this column to open the account’s detailed information page.
Location
Employee range
Revenue range
Industry
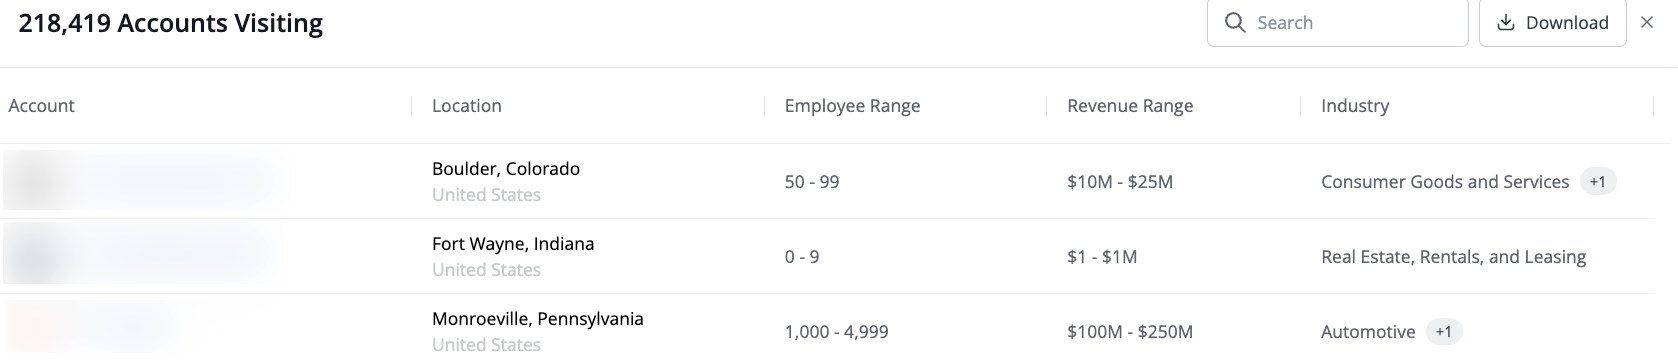
You can search the list, and download it as a CSV file.
Document changelog
May 12 2026: First published