The 6QA Trends report allows you, as a marketer, to quickly understand how well you are creating and handing 6sense qualified accounts (6QAs) off to your sales team members.
Report metrics include:
The identified 6QAs and of those, how many are new.
6QAs that have had sales activity.
Key indicators about how well the accounts with sales activity have been worked.
6QAs are an efficient and effective way to create a pipeline and ultimately closed-won deals. This report gives marketers tools to measure new account qualification and handoff trends for any saved segments, allowing you to measure how many accounts become qualified over extended periods of time.
For example, you can filter this report to view trends for go-to-market (GTM) style segments, for segments used for campaigns, or for any other segment, giving you insights into whether marketing campaigns are hitting their targets. In addition to creation and handoff trends, other metrics include the key inputs toward successfully converting accounts to opportunities.
All ABM users in 6sense can view the report. SI users must be Primary or Sales Administrators to view the report; Sales SDR and AE users cannot access the report.
Also refer to the related report, the Predictive Model report.
Prerequisites
Your 6sense account must have the Predictive add-on.
Metrics provided in the reports
The following metrics display in the 6QA Trends report, for all dimensions.
Total 6QAs | Total number of accounts that met the criteria for a 6sense qualified account (6QA) within the time period. |
New 6QAs | The number of new 6QAs generated within the time period. |
Worked | The percentage of 6QAs that had at least one sales activity, such as an email, call, or meeting. |
Unworked | The percentage of 6QAs that had no sales activities, such as an email, call, or meeting. |
Average Sales Activities | The average number of outbound sales activities (emails, calls, or meetings) performed on a 6QA. |
Average Contacts Reached | The average number of unique contacts within qualified accounts (6QAs) that have been engaged with ( email, call, meeting) through sales and marketing efforts. |
Avg Days to First Sales Activity | The average time it takes for a sales representative to initiate the first sales activity (email, call, meeting) with a 6QA. |
Avg Days Since Last Sales Activity | The average time elapsed since the last sales activity (email, call, meeting) was performed on a 6QA. |
Access the 6QA Trends report
To review the 6QA Trends report:
Go to ABM > Reports.
Select 6QA Trends.
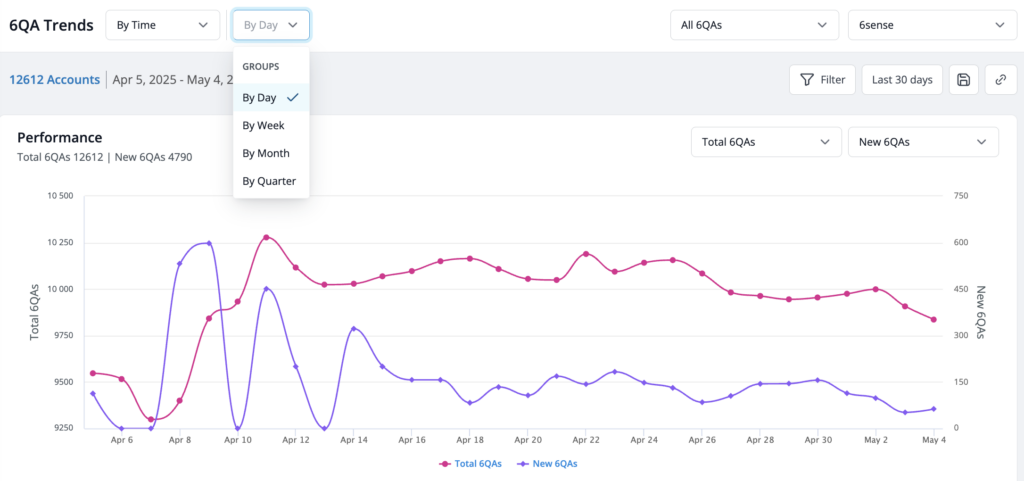
The report displays:
The report headers show the total number of accounts and the date range of the report. The headers include controls to:
Change the report’s dimension (time, CRM status, reach score)
Change the time grouping (day, week, month, quarter)
Change the segment used for the report
Change the product (Predictive model, if your organization has more than one)
Filter the results
Change the date range
Save the report
Copy a link to the report
A 6QA performance trends time dimension line chart, where you can:
Choose two metrics to display
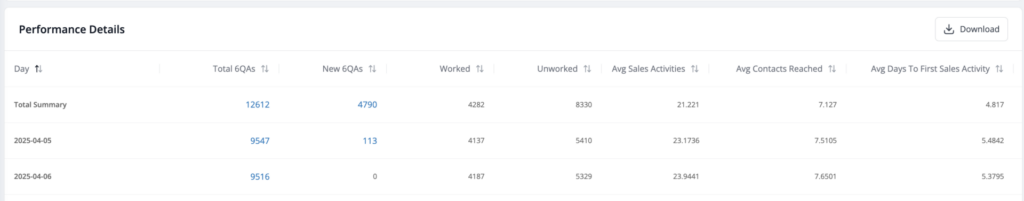
Review the time dimension Performance Details list, where you can:
Sort the columns ascending or descending
Download as a CSV file
Use the filters and menus to adjust the metrics displayed in the report, as described in the following sections.
Adjust data dimensions
You can adjust the dimension of the data you want to examine in the report.
Dimensions include time, CRM status, and reach score.
Time dimension: total and new 6QAs over time
The time dimension shows a line chart of the selected metrics over time. (By default it shows the total 6QAs and new 6QAs).
Use the menu to group the time by day, week, month, or quarter.
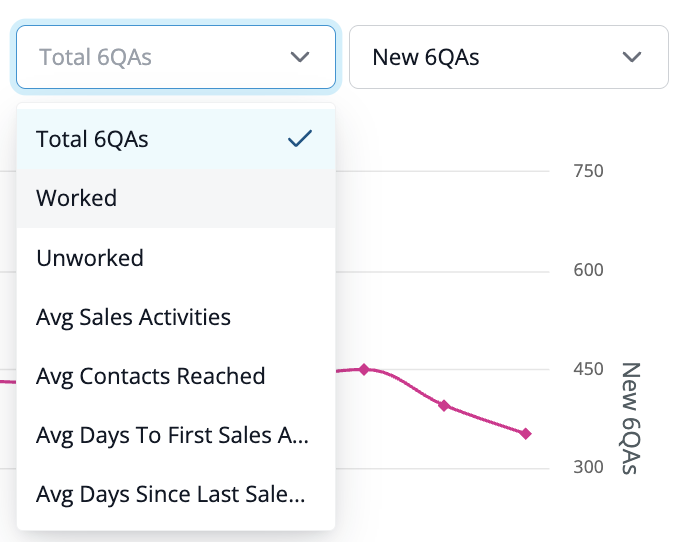
Change metrics to compare in the time dimension chart
Use the two menus on the right of the time dimension trend chart to review the relationships between two metrics. By default the chart compares Total 6QAs versus New 6QAs. Options include:
Worked
Unworked
Avg Sales Activities
Avg Contacts Reached
Avg Days to First Sales Activity
Avg Days since Last Sales Activity
Review performance details of the time dimension report
When using the time dimension, 6sense displays a Performance Details list of metrics, below the time chart, that you can browse and download.
You can click on numbers in the Total 6QAs and New 6QAs columns to view more details and download additional information. Refer to Get a list of accounts that are in the reports later on this page.
CRM status dimension: 6QAs in and not in the CRM
The CRM status dimension lists metrics about 6QAs that are in the CRM or not in the CRM.
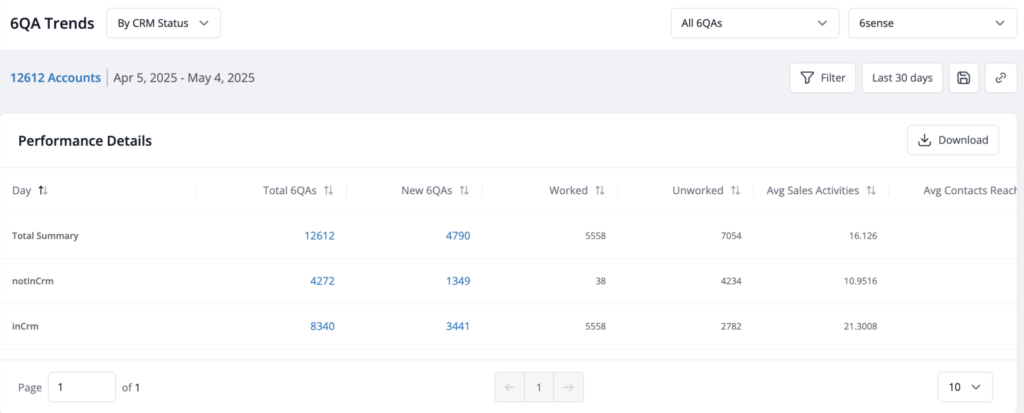
The Total 6QAs and New 6QAs columns have numbers that link to a downloadable account list. Refer to Get a list of accounts that are in the reports reports, later on this page.
Reach score dimension: low, medium, or high
The Account Reach score measures appropriate sales and marketing outreach activities on an account compared against the optimal quality, quantity, and diversity of outreach activities as defined by your company’s historical success on won opportunities. Refer to 6sense Scores Overview.
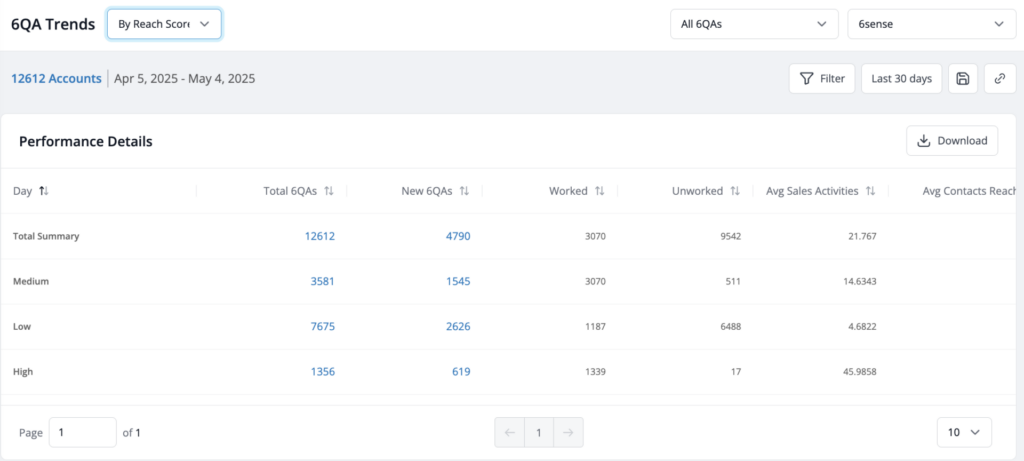
The Total 6QAs and New 6QAs columns have numbers that link to a downloadable account list. Refer to Get a list of accounts that are in the reports reports, later on this page.
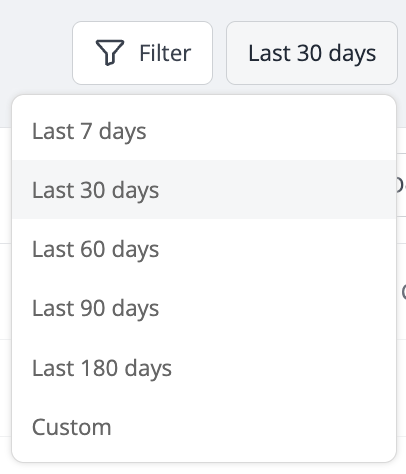
Adjust the date range
At the top right of the report you can change its date range.
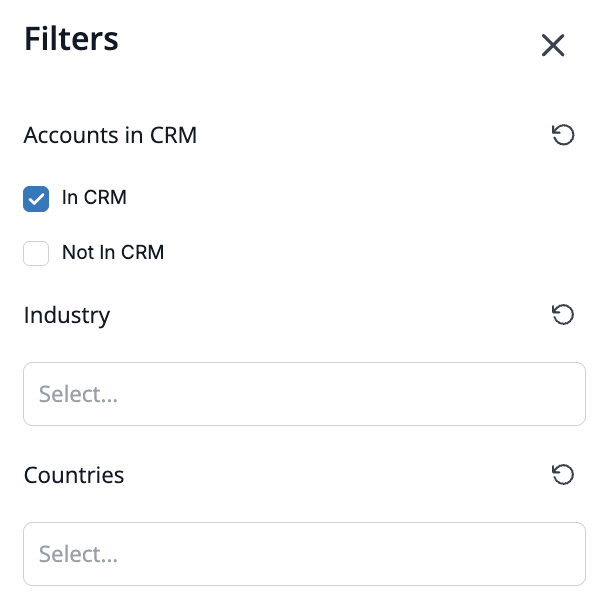
Adjust filters
In addition to dimensions, you can use filters to focus the contents of the report. Filters include
Accounts in CRM or Not in CRM
The report by default filters out accounts that do not have a matched CRM account.
Industry
Country
Get a list of accounts that are in the reports
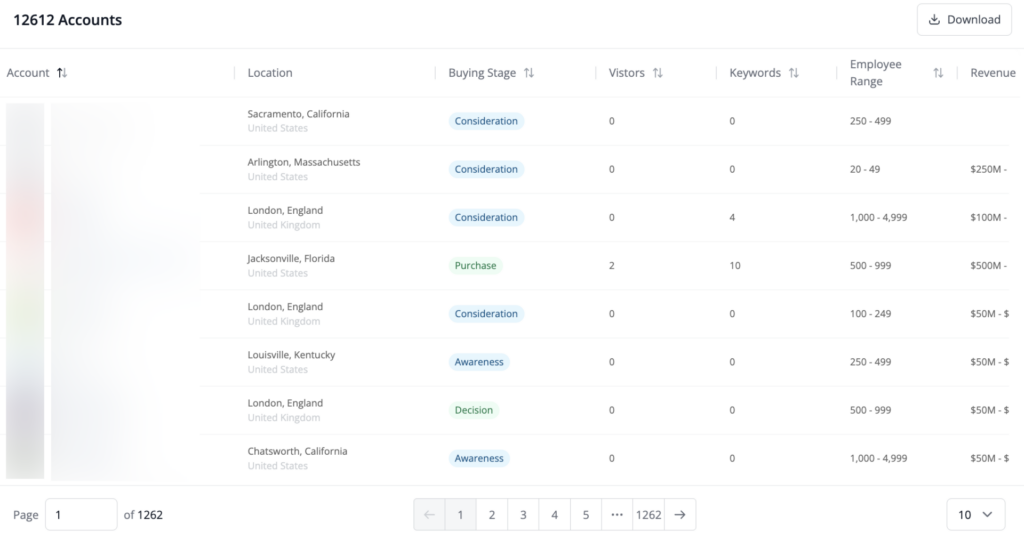
All reports that have links for the count items provide a browsable display of the accounts and a link to download account details. Click the relevant link to open the details popup, with its Download link.
Display report details
The report details display:
Account
Location
Buying Stage
Visitors
Keywords
Employee Range
Revenue Range
Industry
Downloaded account details
If you download the account lists, more data is available.
All data is as-of today. Account list downloads include these columns:
Account Name
Country
Domain
Product
MID (6sense account identifier)
CRM ID (blank if no match)
State
City
Employee Range
Revenue Range
Industry
Buying Stage
6QA Status
Profile Fit
Reach Score
Number 30 web visits
Number 30 day keywords searched
Get a list of all 6QA accounts
To get a list of all 6QA accounts:
Select the # of Accounts link.
The list of accounts popup opens. This shows the same display report columns as described in the previous section.
To get a CSV file of the list, select Download. The CVS file has the same report columns as described in the previous section.