The Model Insights report is a detailed analysis of your Predictive model’s performance.
Prerequisite
At least one active Predictive model
Access the Model Insights report
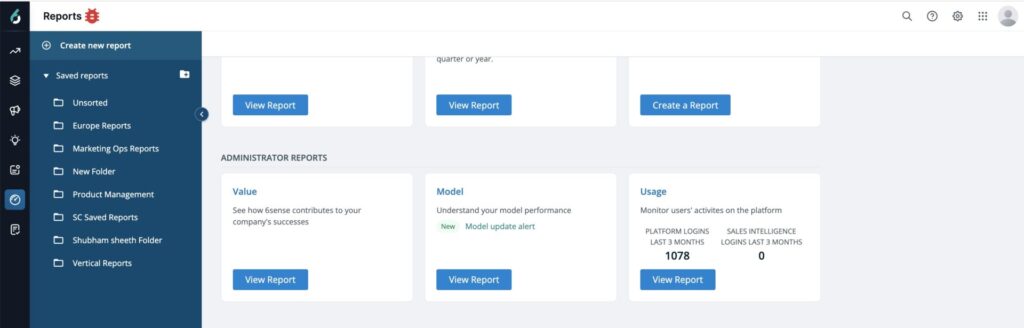
To access the Model Insights report:
Go to ABM > Reports.
Select Model.
Other Administrator report types include:
Scores used in the report
To better understand the metrics scores used in the report refer to 6sense Scores.
The report shows the performance of your models created by 6sense for Account Behavior, Account Profile Fit, Contact Behavior, and Contact Profile Fit. Any opportunity related data shown on Model Insights is based out of Relevant Opportunity definition that you have provided to 6sense.
Account behavior model
This analysis validates the prioritized accounts identified by 6sense as having a high likelihood of initiating an opportunity within the next three months due to their strong intent signals. The data is refreshed monthly and is based on a model backtest conducted on accounts, scored 90 days earlier. For example, if the current month is March’ 24 , the dropdown specifies the backtest month as of December ’23.
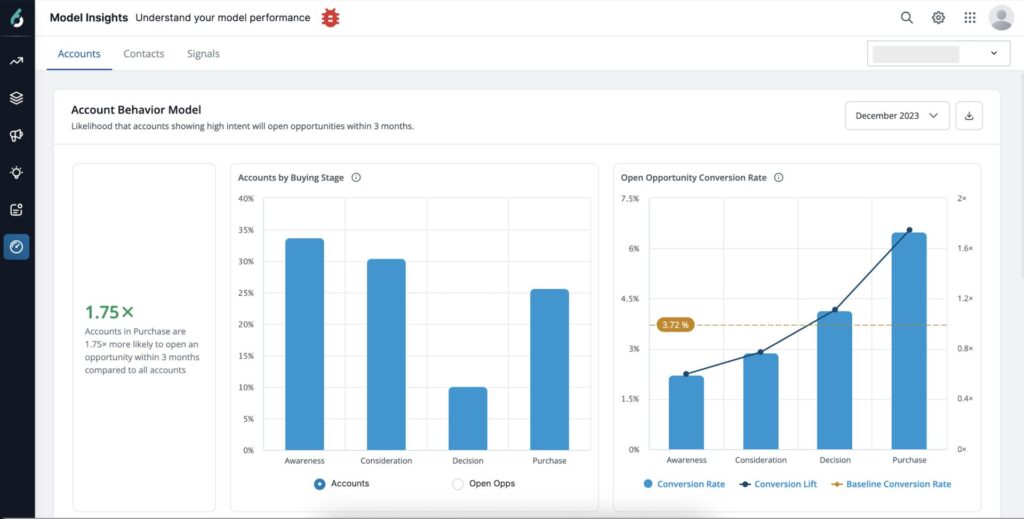
Buying Stage: This denotes the relevant buying stage based on intent score of the accounts, corresponding to the metrics in following categories.
Accounts by Buying Stage: This metric represents the percentage of all CRM accounts in each buying stage based on their intent score as of the specified month.
View by Accounts: Represents the percentage of all CRM accounts in each buying stage. Hover on the bar chart to know the number of CRM accounts that correspond to the percentages shown for each buying stage.
View by Open Opps: Represents the percentage of all open relevant opportunities in each buying stage opened in next 3 months from the chosen month. Hover on the bar chart to know the number of opportunities that correspond to the percentages shown for each buying stage. The data shown for opportunities is based on the relevant opportunity definition provided to 6sense.
Open Opportunity Conversion Rate: This metric, for the specified month, calculates the percentage of CRM accounts that reached a specific buying stage and subsequently opened a relevant opportunity within three months.
Baseline Conversion Rate: Represents the percentage of CRM Accounts with an opportunity opened within three months of the specified month, out of all accounts that showed any intent during the specified month.
Conversion Lift: Shows the effectiveness of working accounts in a particular buying stage relative to the baseline. It is calculated as the conversion rate for that buying stage divided by the baseline.
A good model should show a higher conversion rate for Purchase and Decision Accounts as compared to Baseline and other buying stages.
Account profile fit model
This analytic compares the proportion of your CRM Accounts that 6sense has classified as being relevant for your business based on profile fit, to the proportion of opportunities that have been opened and eventually won within each profile fit classification. These metrics are refreshed daily.
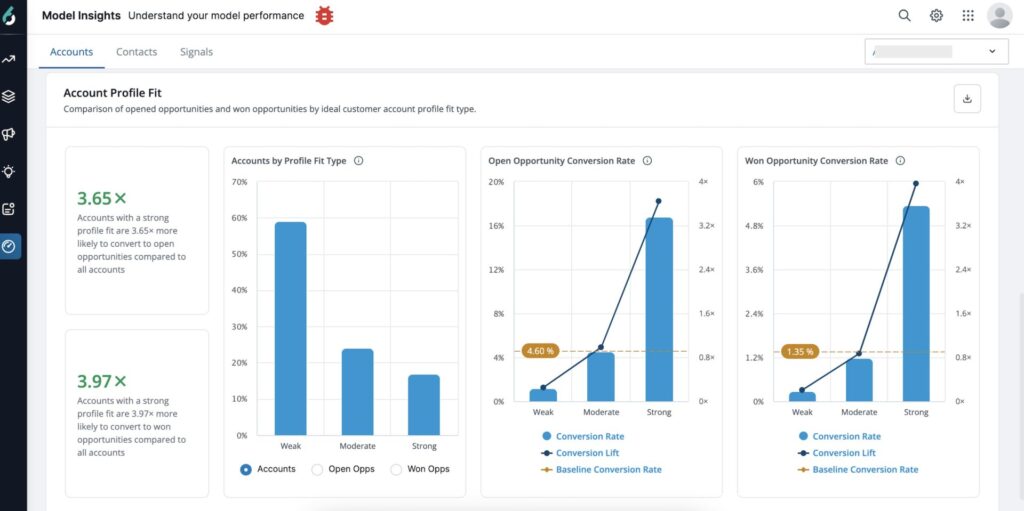
The data pertaining to Opportunities shown in metrics is based off of the relevant opportunity definition you provided to 6sense.
Accounts by Profile Fit: This metric represents the percentage of CRM Accounts by Strong, Moderate and Weak Profile Fit as classified by the model based on relevancy to your business. You can view this metric based on accounts or Open Opps or Won Opps.
View by Accounts: Represents the percentage of all your CRM accounts classified into each profile fit. Hover on the bar chart to see the number of accounts that correspond to the percentages shown for each profile fit.
View by Open Opps: Represents the percentage of all of your opened opportunities in each profile fit. Hover on the bar chart to see the number of opportunities that correspond to the percentages shown for each profile fit.
View by Won Opps: Represents the percentage of all of your won opportunities in each profile fit. Hover on the bar chart to know the number of opportunities that correspond to the percentages shown for each profile fit.
Open Opportunity Conversion Rate: This metric represents the percentage of accounts in each profile fit that were associated with at least one open opportunity.
Baseline Conversion Rate: Represents the percentage of CRM Accounts with at least one open relevant opportunity across all profile fits.
Conversion Lift: Shows the effectiveness of working accounts in a particular profile fit relative to the baseline. It is calculated as the conversion rate for open opportunity for that profile fit divided by the baseline.
Won Opportunity Conversion Rate: This metric represents the percentage of accounts in each profile fit that were associated with at least one won relevant opportunity.
Baseline Conversion Rate: Represents the percentage of CRM Accounts with at least one won relevant opportunity across all profile fits.
Conversion Lift: Shows the effectiveness of working accounts in a particular profile fit relative to the baseline. It is calculated as the conversion rate for won opportunity for that profile fit divided by its baseline.
A good model should have conversion lifts for Strong and Moderate higher than Weak Profile Fits.
Contact behavior model
This analytic validates the contacts that 6sense has prioritized as likely to be associated with an open opportunity in the next three months due to the contact’s high intent. It compares the proportion of those contacts classified within Contact that did lead to an opportunity being created within 3 months to the baseline of open opportunity conversion rate across all contacts that showed any intent during the specified month. These metrics are refreshed monthly. For example, if the current month is March’ 24 , the dropdown specifies the backtest month as of December ’23.
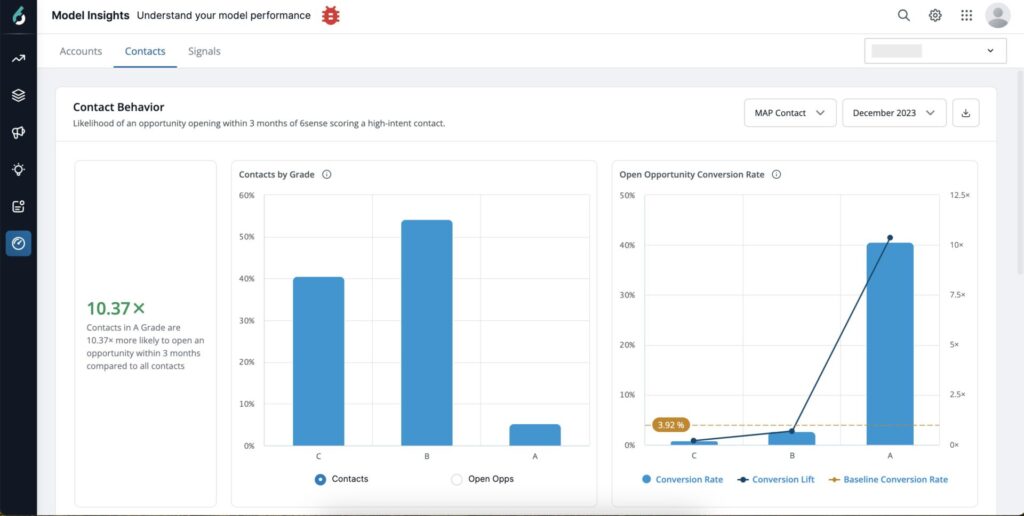
Grade: This denotes the grade based on the engagement score of the contacts, corresponding to the metrics in the following categories.
Contacts by Grade: This metric represents the percentage of all contacts that reached each contact grade based on their engagement score as of the specified month. You can view this metric by Contacts or by Open Opps for each grade. All the below metrics can be viewed by CRM Contacts, CRM Leads, or MAP Contacts.
View by Total Contacts: Shows the percentage of all contacts that reached each contact grade in the specified month. Hover on the bar chart to know the number of contacts that correspond to percentages shown for each contact grade.
View by Open Opps: Represents the percentage of all of your open relevant opportunities having contacts that reached each contact grade. Hover on the bar chart to know the number of opportunities that correspond to percentages shown for each contact grade.
Open Opportunity Conversion Rate: For the specified month and the specified Contact Grade, this metric shows the percentage of the scored Contacts that were associated with an account where an opportunity was created within 3 months, out of all the Contacts that reached that Contact Grade during the specified month.
Baseline Conversion Rate: Represents the percentage of Contacts that were associated with accounts having at least one opportunity created within three months of the specified month, out of all Contacts that showed any engagement during the specified month.
Conversion Lift: This metric shows the conversion rate effectiveness for scored contacts associated with accounts relative to the baseline. It is calculated as the conversion rate for open opportunity for that contact grade divided by baseline.
You will typically be able to validate that conversion lifts for A and B engagement grades are higher than C.
Contact profile fit
This analytic compares the proportion of your known contacts that 6sense has classified as being relevant for your business based on profile fit, to the proportion of affiliated opportunities that have been created and eventually won within each contact profile fit classification. These metrics are refreshed daily.
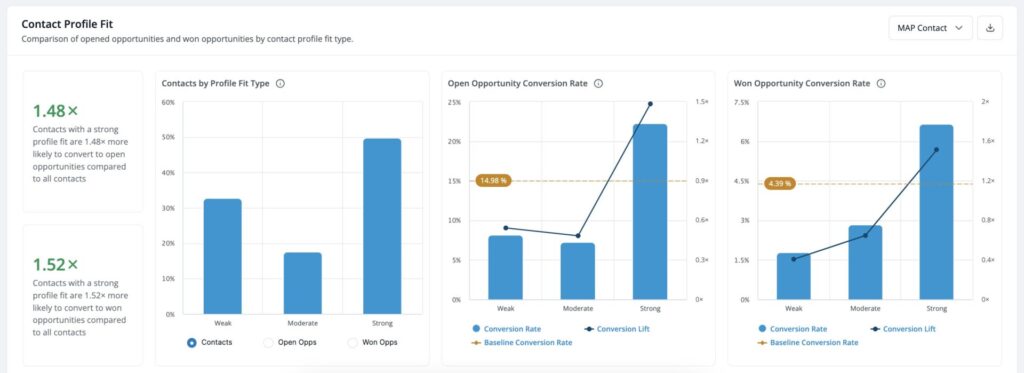
Contacts by Profile Fit: This metric represents the percentage of your known contacts that the 6sense model has classified as Strong, Moderate, and Weak Fits. You can view this metric based on Contacts, Open Opps, or Won Opps. All the below metrics can be viewed by CRM Contacts, CRM Leads, or MAP Contacts.
View by Contacts: Represents the percentage of your known contacts that the 6sense model has classified as Strong, Moderate, and Weak Fits. Hover on the bar chart to know the number of contacts that correspond to the percentages shown for each profile fit.
View by Open Opps: Represents the percentage of all your open relevant opportunities associated with contacts in each profile fit. Hover on the bar chart to know the number of open opportunities that correspond to the percentages shown for each profile fit.
View by Won Opps: Represents the percentage of all your won relevant opportunities associated with contacts in each profile fit. Hover on the bar chart to know the number of won opportunities that correspond to the percentages shown for each profile fit.
Open Opportunity Conversion Rate: This metric represents the percentage of contacts in each profile fit that were associated with accounts having at least one open relevant opportunity.
Baseline Conversion Rate: Represents the percentage of contacts with at least one relevant opportunity across all profile fits.
Conversion Lift: Shows the conversion rate effectiveness for contacts in a particular profile fit relative to the baseline. It is calculated as conversion rate for open opportunity for that profile fit divided by baseline.
Won Opportunity Conversion Rate: This metric represents the percentage of contacts in each profile fit that were associated with accounts having at least one won relevant opportunity.
Baseline Conversion Rate: Represents the percentage of contacts with at least one won relevant opportunity across all profile fits.
Conversion Lift: Shows the conversion rate effectiveness for contacts in a particular profile fit relative to the baseline. It is calculated as conversion rate for won opportunity for that contact profile fit divided by baseline.
You will typically be able to validate that contacts determined by 6sense to be a strong fit based on historical data are more often associated with created and won opportunities when compared to your total set of contacts.
Signals
These are the factors that 6sense’s predictive model may consider when scoring each Account’s or Contact’s Profile Fit. They are broadly classified into firmographic, technographic, and demographic signals.
Firmographic signals
These include characteristics related to the company or organization, such as industry, employee range size, revenue, country, NAICS code etc. This analytic displays up to 50 firmographic factors that 6sense’s predictive model may consider when scoring each Account’s Profile Fit. This does not imply that the model assigns any explicit ranking or importance to each signal, but it simply shows the historical data for which signals are more often associated with won opportunities. These metrics are updated weekly.
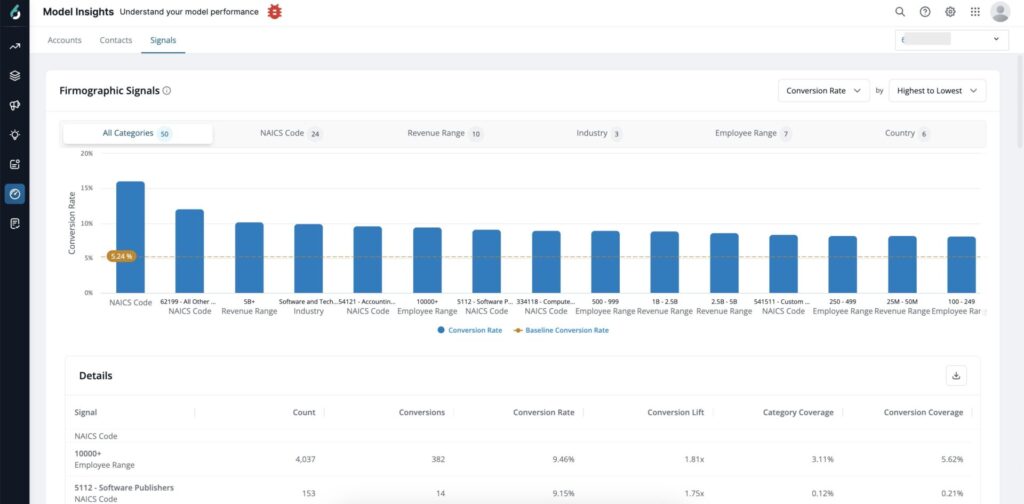
By default, the firmographic signals view is organized in descending order of conversion rate. However, you have the flexibility to sort the view based on count, conversions, conversion lift, category coverage, or conversion coverage. You can view up to 50 signals at a time, either in lowest to highest order or highest to lowest order. You can also choose to filter signals by each category. The number against each category denotes number of signals for that category within the 50 signals shown in the view.
Some important definitions to note:
Signal: A specific value of the affiliated Category.
Count: The number of CRM Accounts classified as the specified Signal.
Conversion: The number of CRM Accounts for that Signal with an opened opportunity.
Conversion Rate: The percentage of all CRM Accounts for that Signal with an opened opportunity.
Baseline Conversion Rate: The baseline conversion rate represents the % of all CRM Accounts that have had at least one opportunity ever created.
Conversion Lift: The conversion rate for that Signal compared to the conversion rate for all CRM Accounts.
Category Coverage: The percentage of CRM Accounts with that Signal compared to the total set of CRM Accounts within the relevant Category.
Conversion Coverage: The percentage of conversions from that Signal compared to the total set of CRM Accounts with conversions within the relevant Category.
Technographic signals
These encompass technological attributes including the software, tools, and technologies used by the accounts. This analytic displays up to 50 technographic factors that 6sense’s predictive model may consider when scoring each Account’s Profile Fit. This does not imply that the model assigns any explicit ranking or importance to each signal, but it simply shows the historical data for which signals are more often associated with won opportunities. These metrics are updated weekly.
By default, the technographic signals view is organized in descending order of conversion rate. However, you have the flexibility to sort the view based on count, conversions, conversion lift, category coverage, or conversion coverage. You can view up to 50 signals at a time, either in lowest to highest order or highest to lowest order. Some important definitions to note:
Signal: The name of the identified technology.
Count: The number of CRM Accounts classified as the specified Signal
Conversion: The number of CRM Accounts with at least one opportunity ever created.
Conversion Rate: The percentage of all CRM Accounts with at least one opportunity ever created.
Baseline Conversion Rate: The baseline for technographic data only considers CRM Accounts where at least one tracked technology can be identified.
Conversion Lift: The conversion rate for that Signal compared to the conversion rate for all CRM Accounts.
Category Coverage: The percentage of all CRM Accounts identified by this Signal.
Conversion Coverage: The percentage of all opportunities ever created that are from accounts identified by this Signal.
Demographic signals
These refer to personal characteristics and demographics, such as job title, role provided by the customer, job level, industry, email domain and any other relevant attributes pertaining to contacts. This analytic displays up to 50 demographic factors that 6sense’s predictive model may consider when scoring each Contact’s Profile Fit. This does not imply that the model assigns any explicit ranking or importance to each signal, but it simply shows the historical data for which signals are more often associated with created opportunities. These metrics are updated weekly.
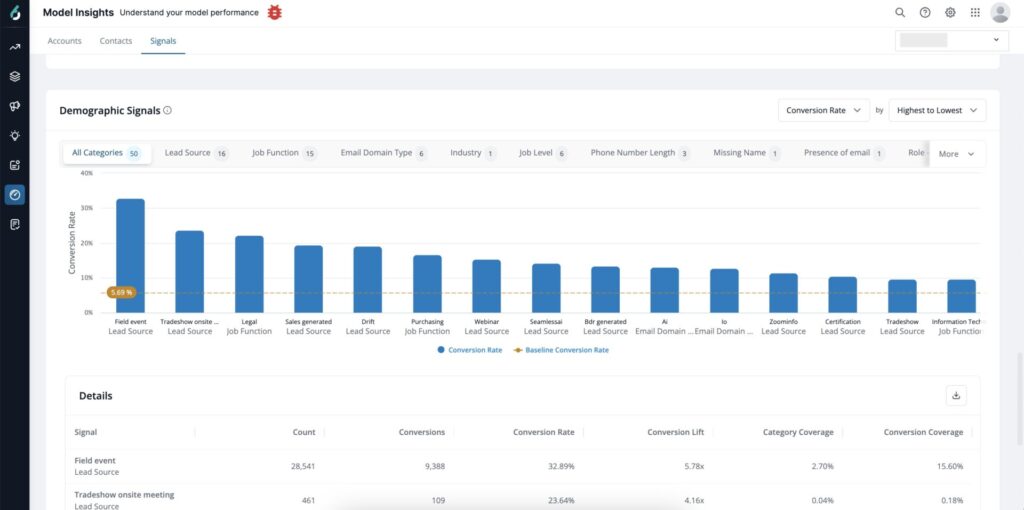
By default, the demographic signals view is organized in descending order of conversion rate across all categories. However, you have the flexibility to sort the view based on count, conversions, conversion lift, category coverage, or conversion coverage. You can view up to 50 signals at a time, either in lowest to highest order or highest to lowest order. You can also choose to filter signals by each category. The number against each category denotes number of signals for that category within the 50 signals shown in the view.
Some important definitions to note:
Signal: A specific value of the affiliated Category.
Count: The number of unique contacts classified as the specified Signal.
Conversion: The number of Contacts associated with at least one opportunity ever created.
Conversion Rate: The percentage of all Contacts with at least one opportunity ever created.
Baseline Conversion Rate: The baseline conversion rate represents the % of all Contacts that have been associated with accounts that have had at least one opportunity ever created.
Conversion Lift: The conversion rate for that Signal compared to the conversion rate for all contacts.
Category Coverage: The percentage of Contacts with that Signal compared to the total set of Contacts within the Category.
Conversion Coverage: The percentage of conversions from that Signal compared to the total set of Contacts with conversions within the Category.
The data related to signals provides valuable insights, it should be primarily considered as directional guidance rather than definitive rankings.
Model updates automated roll out
Model updates are an integral part of our model lifecycle management process. 6sense continuously monitors the performance of your models, seeking opportunities for enhancement and helping you optimize the value of using 6sense. 6sense models are constantly retrained to optimize performance. If 6sense identifies an enhanced version of the account behavior and account profile fit models that can elevate your experience and deliver more precise data than before, rest assured, you will be notified proactively about upcoming model updates at least two weeks in advance, ensuring a seamless transition to latest improvements.
Additionally, we will provide you insights where you can compare the current model and the upcoming updated model version on our Administrator – Model report on the platform. This will ensure you stay informed about any changes that could potentially impact your organization and help you make informed decisions.
At this time, we only support model update insight comparisons for account behavior and account profile fit models.
When 6sense recommends that a model update is available, it means a revised version of the model with an improved performance is available. Overall, an improved model may either lead to:
Increase in the Open Opportunity Conversion Rate for the accounts in the Buying Stages/Profile Fits or / and
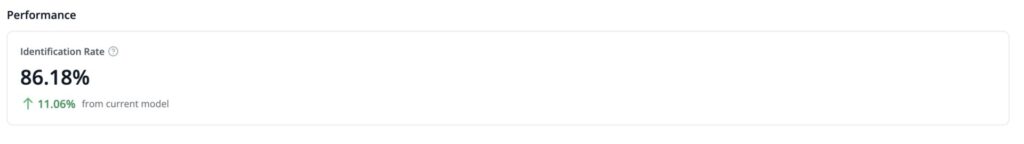
Increase in Identification Rate so model improves on its predictions on accounts that will open opportunities for you.
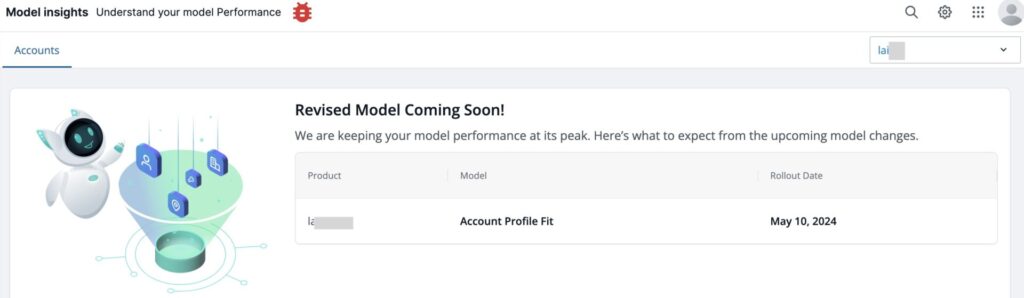
Access model update insights reports
Currently, the insights for comparison are available only for account behavior and account profile fit models. If you have any upcoming model updates, a “Model update alert” displays under the Model report title, if you have access to this report. Select View Report.
Alternatively, if you are an Administrator, you can also access the insights through the quick link on the proactive email notification sent by 6sense about the upcoming model update.
Interpret model update information
The first section provides an overview of the Account models for which improved versions are available, along with the date on which the model update will be rolled out. By default, if there is a model update available for the default product category selected, it will load the insights automatically on the page. If at any time the model update is available for more than one product category, you can select Review Now to view insights for each model. Alternatively, you can use the product category selection filter.
6QA impacts

It is normal to see a spike in 6QA numbers on the day the model update gets rolled out, due to accounts changing buying stages or profile fits based on if the model update is available for account behavior or account profile fit respectively. This section will inform you of the magnitude of such spikes that may happen because of model updates on accounts in 6QA. Additionally, it will also show you if the average number of 6QAs you see each day would increase or decrease in the updated model.
The increase/decrease in average number of 6QAs in the updated version of the model is because of model improvements with updated predictions. You may also see new 6QAs in the process. We highly recommend you communicate these insights to teams who are leveraging the 6QAs at your organization, so they are prepared for this update.
Account behavior model comparison
If the model update is identified by 6sense for account behavior for a product category, you will be able to validate how the metrics would look for current and the upcoming models. The month filter would still show back test results for 90 days before, from the current month. You can view the comparison for these metrics for one last backtest only.
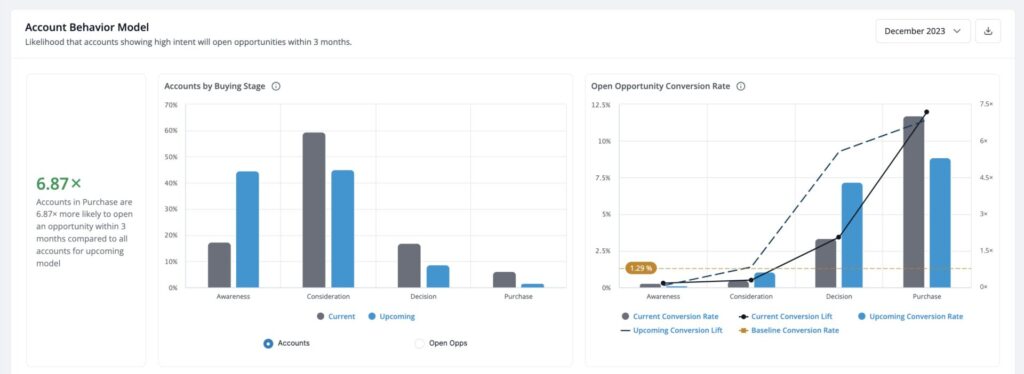
Account Behavior Model Comparison
Any opportunity related data that is shown on this page is based off the relevant opportunity definition that you provided to 6sense.
Accounts by Buying Stages: You can view this metric either by Accounts or by Open Opps as stated below.
View by Accounts: A comparison of proportion of all CRM Accounts by Buying stages as classified by the current versus upcoming version of model.
View by Open Opps: A comparison of % of total opportunities opened for CRM accounts in each buying stage for current versus upcoming version of model. Hover on the bar corresponding to each buying stage to read the counts of opportunities for current versus upcoming model.
Open Opportunity Conversion Rate: A comparison of Conversion rates (how many accounts resulted in opening opportunities within the next 3 months from the specified month across each buying stage) for current versus upcoming version of the model.
Conversion Lift: A comparison between the Conversion lifts for current and upcoming versions of the model across each buying stage. Conversion Lift shows the effectiveness of working accounts in a particular buying stage relative to the baseline. It is calculated as Conversion rate for that buying stage divided by baseline.
In some cases, the validation report may show that the updated version of the model has a slightly lower conversion rate for purchase as compared to the current model. As the model predictions are improved through continuous learning and retraining, accounts may move buying stages with the upcoming model. Hence it is normal to show increase/decrease in these metrics. However, the updated model should still have a conversion rate higher for purchase and decision stages as compared to the baseline and conversion rates for accounts in awareness and consideration buying stages.
Identification rate
Out of the proportion of all opportunities that were opened, a validation of how well the current and the upcoming models performed in predicting accounts in purchase and decision stages that lead to open opportunities.
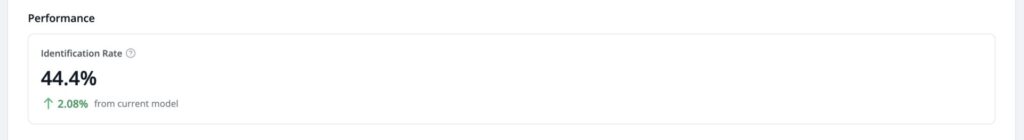
The model performance may at times be a tradeoff between the conversion rate and the identification rate. While fine tuning the models to improve performance, while one of these metrics increases, the other may slightly show a dip. You may see both these metrics improving in a few cases too. This is expected and nothing that you should be worried about. A model update will be deemed necessary by 6sense even if one of these metrics shows a great improvement.
Transitions impact
This analytic shows the transition of existing accounts in each buying stage to the new buying stages with upcoming model update. This does not mean every account moves from its earlier buying stage. The first column shows the total accounts in each buying stage and then the subsequent columns show the transitions of how many accounts will transition their buying stages due to updated predictions. The last column in the table shows the resultant count of accounts in each buying stage with upcoming model.
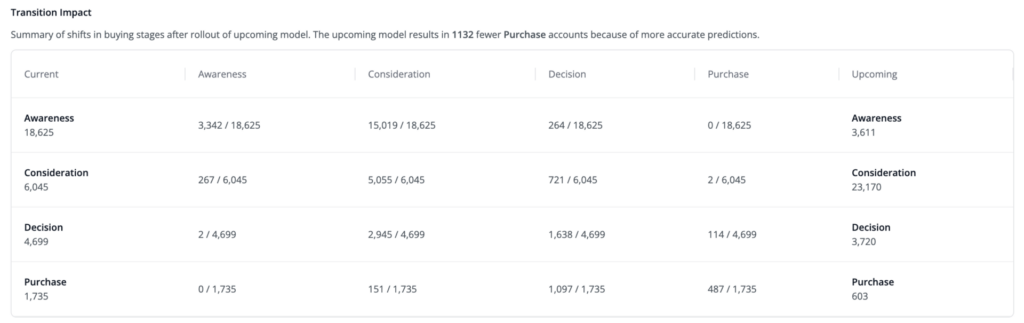
For example:
There are 1,735 accounts in Purchase based on current model per above screenshot.
0 out of 18,625 accounts from Awareness move to Purchase.
2 out of 6,045 accounts from Consideration move to Purchase with updated model.
114 out of 4,699 accounts from Decision move to Purchase with updated model.
487 out of Purchase accounts from Purchase stay in Purchase with updated model.
That results in 603 Accounts in Purchase with the updated model.
Account profile fit model comparison
If the model update is received for account profile fit for a product category, you can validate how the upcoming model performance would have been if it was the acting model, through some insights of comparison with current profile fit model.
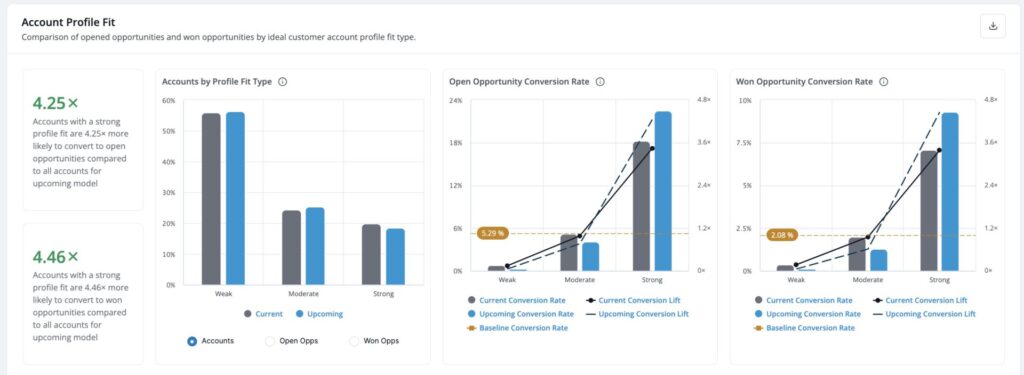
Accounts by Profile Fit: You can view the profile fit distribution by Total Accounts, Open Opps or Won Opps.
View by Accounts: A comparison of proportion of CRM Accounts by Strong/Moderate and Weak Profile Fit as classified by the current versus upcoming version of model.
View by Open Opps: A comparison of opportunities opened for the CRM accounts classified into Strong/Moderate and Weak profile fits by current versus upcoming version of model.
View by Won Opps: A comparison of opportunities won for the CRM accounts classified into Strong/Moderate and Weak profile fits by current versus upcoming version of model.
Open Opportunity Conversion Rate: A comparison of Conversion rates (how many accounts resulted in opening at least one opportunity across strong, moderate, and weak profile fit as classified by current versus upcoming version of the model.
Won Opportunity Conversion Rate: A comparison of Conversion rates (how many open opportunities converted into won opportunities) across strong, moderate, and weak profile fit as classified by current versus upcoming version of the model.
Conversion Lift: A comparison between the Conversion lifts for current and enhanced version of the model across each profile fits.Conversion Lift shows the effectiveness of working accounts in a particular profile fit relative to the baseline. It is calculated as Conversion rate for that profile fit divided by baseline.
A good model should always have conversion lifts for Strong and Moderate higher than Weak profile fits.
Identification rate
Out of the proportion of all opportunities that were won, a validation of how well the current model performed compared to the upcoming model in predicting accounts in Strong and Moderate that lead to won opportunity.
Transition impact
This analytic shows the transition of existing accounts in each profile fit to the new profile fit with upcoming model update. This does not mean every account moves from its earlier profile fit it was seen earlier with current model. The first column shows the total accounts in each profile fit and then the subsequent columns show the transitions of how many accounts will transition their profile fit stages due to updated predictions. The last column in the table shows the resultant count of accounts in each profile fit with upcoming model.
![]()
For example:
1673 out of 34,072 accounts from Weak move to Strong with updated model.
7382 out of 25,344 accounts from Moderate move to Strong with updated model.
4,748 out of 10,485 from Strong stay in Strong with updated model.
Hence 13803 Accounts will appear in Strong with the updated model.
FAQ: Model Insights Report
How frequently do metrics update for models?
The update frequency depends on the section:
Profile Fit for both Accounts and Contacts are updated daily.
Firmographic, Technographic, and Demographic Signals are updated Weekly.
Behavior for both Accounts and Contacts are updated monthly.
Which accounts, leads, contacts, and opportunities are considered by Model Metrics?
By default, there are no constraints on the age or type of records that will be considered. As part of onboarding, customers typically work with their Customer Success Manager to identify certain types of records that should be excluded from scoring or are otherwise deemed irrelevant for analysis within 6sense. If any CRM or MAP objects have been excluded during onboarding, they will not contribute to data shown within Model Metrics.
Is this report looking at only relevant opportunities based on model taxonomy or looking at all accounts and opportunities?
The report shows all CRM accounts scored. The score itself is created by using the relevant opportunity definition as an anchor point for the report to score profile fit. The total number of accounts is across the board, but the percentage for open/won accounts is based on the relevant opportunity, not all opportunities.
Can I filter any of this analysis by segment?
No. At this time, Model Metrics will only be displayed across all eligible accounts.
Is any data in the signals filtered out?
Infrequently occurring signals will not be shown – these are defined as any signals below 0.1% Category Coverage or Conversion Coverage.
Why can’t I see data for the three most recent months?
By definition, this analytic waits three months from the time an account is scored as having some level of intent, in order to give your ABM strategy sufficient time to work towards opening an opportunity.
The basis for this is to give the user 90 days from 6QA qualification to create relevant opportunities. As Intent Stages are dynamic to Accounts (Accounts can move from one stage to another after 6QA), this report therefore calculates the likelihood to create Opportunities looking back three months from today (which calculates likelihood based on these changes), versus projecting the future state based on today’s performance/6QA status.
When are report changes reflected in the platform?
While reports update monthly, changes aren’t reflected in the platform until the 3rd of each month.
FAQ: Model Update
Why is my organization receiving a model update?
6sense consistently monitors and evaluates the performance of all customer models. When deviations in performance occur, attributed either to shifts in signal patterns or modifications in data sources, models will be retrained. If an upgraded model capable of enhancing performance is identified during this process, proactive notifications will be sent to application administrators about the upcoming model update two weeks in advance of the roll out.
Why does a spike in 6QA accounts happen on the model update roll out date?
As 6sense aims at improving the performance of your model, accounts may move the buying stages/profile fits of accounts depending on which Account model the update is for. There may also be 6QAs which newly qualify. This results in a one-time spike on the model update roll out date. The count of 6QAs that attributes to the spike takes into account an overlap of 6QAs that existed before and created newly with the upcoming model.
Who gets notified when there is a model update?
All the application Administrators will be notified at least 2 weeks in advance when there is a improved model update available for your company. The notifications will be resent once every 6 days until the model update is finally rolled out on 14th day from the time administrators are first notified.
Can I stop the model update process?
No. A model update brings the advantage of 6sense aiding in optimizing your value by assisting in prioritizing the most suitable set of accounts. This is achieved through an ongoing learning process, ensuring enhanced accuracy over time. Consequently, halting a model update is not an option.
Is there an action that is required from me when I receive the model update email?
Model updates will be seamlessly rolled out on the specified date and communicated to all administrators via email notifications. Other than sharing this information with your teams leveraging 6QAs so they are prepared to manage any impacts on 6QA, there is no other action that will be required from your side.
Why do I see a drop in the conversion rates or identification rates on the model insights comparison page even though 6sense says that this is an improved model?
The model performance may at times be a tradeoff between the Conversion Rate and the Identification Rate. As the model improves with upcoming version, the buying stages or the profile fit of accounts may get updated depending on which model ,the update is for. The volume of opportunities in each stage/fit type may get updated which may sometimes cause a slight dip in either conversion rate/ identification rate. You may see both these metrics improving in a few cases too. A model update will be deemed necessary by 6sense even if one of these shows a great improvement.