The Value Metrics report helps you understand the impact that 6sense has had on their marketing and sales pipeline.
The Value Metrics report is populated for customers that have a valid integration between their CRM platform and 6sense, with data availability dependent on their 6sense packaging and data integrations. Customers must have one full calendar’s month of data available in order for the Value Metrics report to generate appropriately.
For more information about downloading data from Value Metrics, please refer to Data Available When Downloading Files from Value Metrics.
To access the reports:
Go to ABM > Reports.
Select Value.
Other Administrator Reports:
The following video covers 6sense predictive models and their business impact on Value Metrics:
Overview
The Value Metrics page is divided into the following reporting subsections:
Accounts Worked by Sales after 6sense Predicted: Showcases the pipeline generated (at least one opportunity opened) for accounts within each predictive 6sense Buying Stage.
Accounts with No Created Opportunities: Showcases the accounts in Decision and Purchase stage with no created opportunities that 6sense helped clients identify.
Activities by Source for Accounts with Opportunities: Showcases the activities performed by/on accounts in the pre- and post-pipeline status.
Campaigns Influencing Opportunities: Showcases the impact of 6sense display campaigns on customers’ created pipeline.
Website Match Rates: Showcases the percentage of customers’ accounts’ web page views that 6sense matches to an account using the 6sense Company Identity Graph.
Each subsection’s view can be customized with the following parameters:
Product: Customers that have multiple 6sense products can select which product they want to analyze.
Country: Customers that manage opportunities in multiple countries can select the country they want to analyze.
Filter by Location: Customers can view value metrics at an aggregated level. You can select a region (NA, EMEA, APAC, or LATAM) or specific countries you wish to view visualizations for. You can change countries from the default selection of countries to meet your company’s definition of region if needed. The default definitions of which countries are included in a region are outlined in the CSV file attached to this article.
Note: If you don’t see Filter by Location in Value Metrics, you may be managing opportunities with multiple different currencies. You can create a support ticket to request the internal 6sense team to enable this feature. You will need to provide the field in your company’s CRM for estimated revenues and pipeline that maps to the converted amounts in US dollars (USD).Selected Month: Calendar months.
Exclude Irrelevant Opportunities: Opportunities may be irrelevant if they do not meet the data mapping logic as defined during a customer’s 6sense onboarding process: they may not be fully mapped to the appropriate product, have the appropriate pipeline creation logic, or otherwise pollute a company’s analysis. Selecting this option will exclude such opportunities from their value metrics visualizations.
Exclude $0 Opportunities: Depending on individual customers’ sales data practices, some opportunities may be created without an associated pipeline estimate. Selecting this option enables customers to exclude such opportunities from their value metrics visualizations.
Accounts Worked by Sales after 6sense Predicted
This section highlights the relationship between 6sense Buying Stages and their created pipeline, showcasing the maximum 6sense Buying Stage in the 90 days preceding the created opportunity date for all accounts with opened opportunities in the selected month.
Customers should generally expect that the majority of their opportunities should come from accounts in the Decision and Purchase Buying Stages, signaling 6sense’s identification of strong account intent.
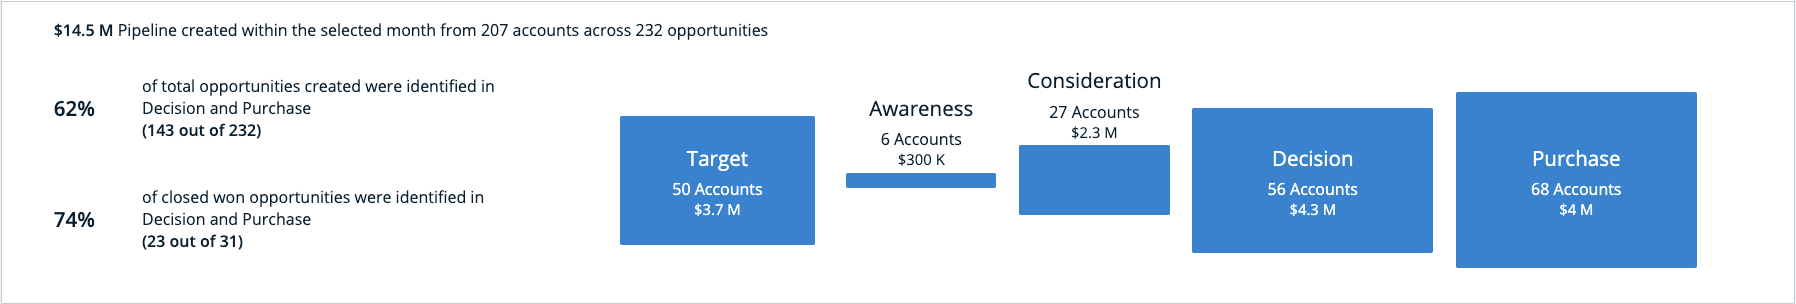
The above data example can be interpreted as follows:
“$14.5 M Pipeline created within the selected month…”: The customer has created $14.5 million pipeline across all of their accounts tracked within their CRM.
“62% of total opportunities were identified in Decision and Purchase”: The majority of the customer’s newly created opportunities were in the Decision and Purchase stage as identified by 6sense, indicating that these Buying Stages can be successfully used as a proxy for account interest.
“74% of closed won opportunities were identified in Decision and Purchase”: 6sense’s Decision and Purchase Buying Stages are successfully indicating account intent and likeliness to purchase.
“Purchase – 68 Accounts – $4 M”: Of all opportunities created in the selected month, 68 accounts were in the Purchase Buying Stage with a total of $4 million pipeline.
Accounts without recent opportunities
This section describes the number of incremental in-market accounts that 6sense has identified that have not had recent opportunities opened on them.
Accounts in Decision and Purchase stages represent high intent accounts that users should investigate for potential opportunity creation, while accounts in the Awareness and Consideration stages can be considered for education/nurture campaigns.
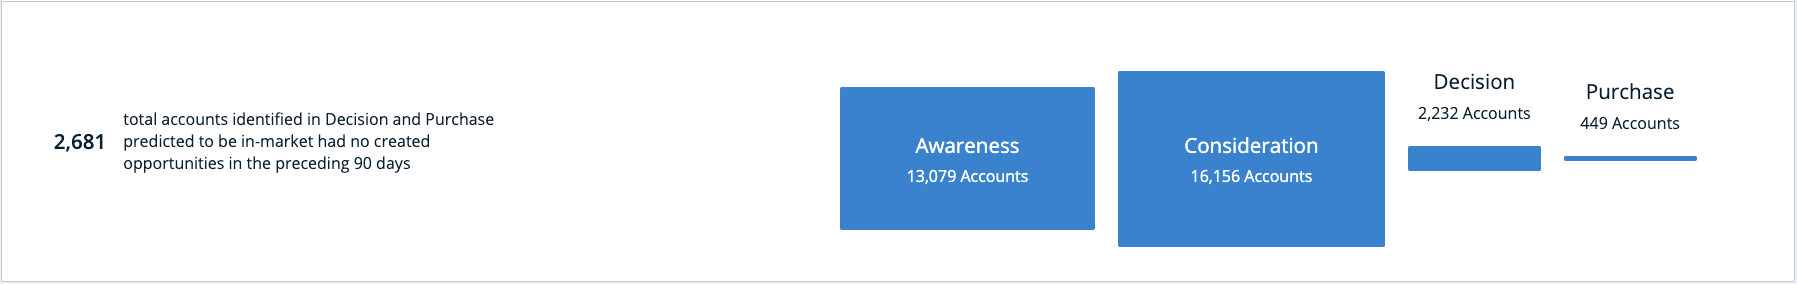
The above data example can be interpreted as follows:
“2,681 total accounts identified in Decision and Purchase predicted to be in-market had no created opportunities in the preceding 90 days”: 6sense helped this customer identify 2,681 accounts in the latter Buying Stages that did not previously have an opportunity created. Using this information, the customer can create and prioritize these additional opportunities.
“Purchase – 449 Accounts”: 6sense identified 449 accounts in the Purchase Buying Stage for which this customer did not previously create an opportunity.
Activities by source for accounts with opportunities
With 6sense fully integrated into their sales and marketing tech stack, customers can identify the impact of their marketing and sales efforts on accounts in the pre-pipeline (no opportunity created) vs. post-pipeline (opportunity has been created) process.
Accounts that have been engaged through more channels are generally more likely to lead to pipeline.
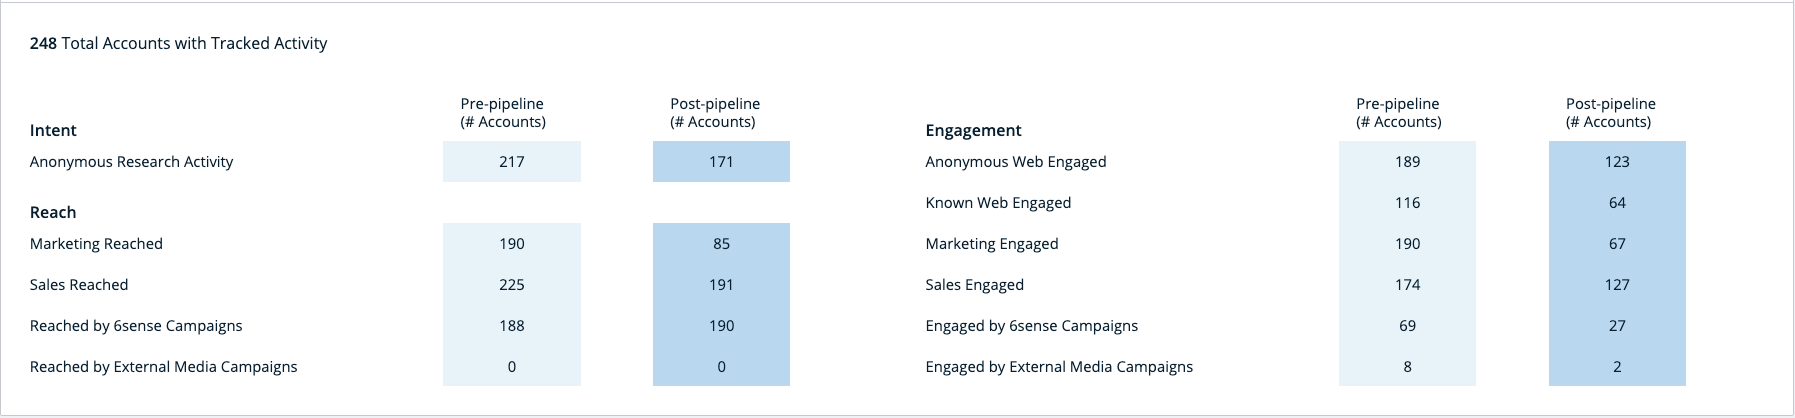
These activities are aggregated into the following intent, reach, and engagement groupings:
Activity Type | Activity | Definition | Data Source |
|---|---|---|---|
Intent | Anonymous Research Activity | Number of accounts researching your configured keywords | Your configured keywords via 6sense |
Reach | Marketing Reached | Accounts reached by email or other campaigns run through your MAP or CRM | Your MAP and CRM Campaigns |
Sales Reached | Accounts reached by your sales activity as tracked by your CRM (emails, calls, and voicemails) | Your CRM Events and Tasks | |
Reached by 6sense Campaigns | Accounts reached (served an ad impression) by your 6sense campaigns | 6sense | |
Reached by External Media Campaigns | Accounts reached (served an ad impression) by your DSP campaigns | Your DSP via 6sense identity | |
Engagement | Anonymous Web Engaged | Accounts visiting your website as identified by 6sense | Your website activity via 6sense identity |
Known Web Engaged | Accounts visiting your website that your marketing automation platform (MAP) is able to identify | Your MAP | |
Marketing Engaged | Accounts engaging with your campaigns | Your MAP and CRM Campaigns | |
Sales Engaged | Accounts engaging with your sales activity as tracked by your CRM (replying to an email, taking a phone call, etc. | Your CRM | |
Engaged by 6sense Campaigns | Accounts engaging with (clicking through) your 6sense campaigns | 6sense | |
Engaged by External Media Campaigns | Accounts engaging with (clicking through) your DSP campaigns | Your DSP via 6sense integration | |
Attended Webinars | Accounts that attended your webinars | Your CRM & MAP | |
Attended Trade Shows | Accounts that attended your trade shows | Your CRM & MAP | |
Attended Field Events | Accounts that attended your field events | Your CRM & MAP |
Campaigns influencing opportunities
6sense display campaigns are a valuable account-based marketing tool that can be used to move accounts through a marketing and sales funnel.
Customers leveraging 6sense display campaigns can refer to this visualization to understand the influence that those campaigns have had on their opportunities.
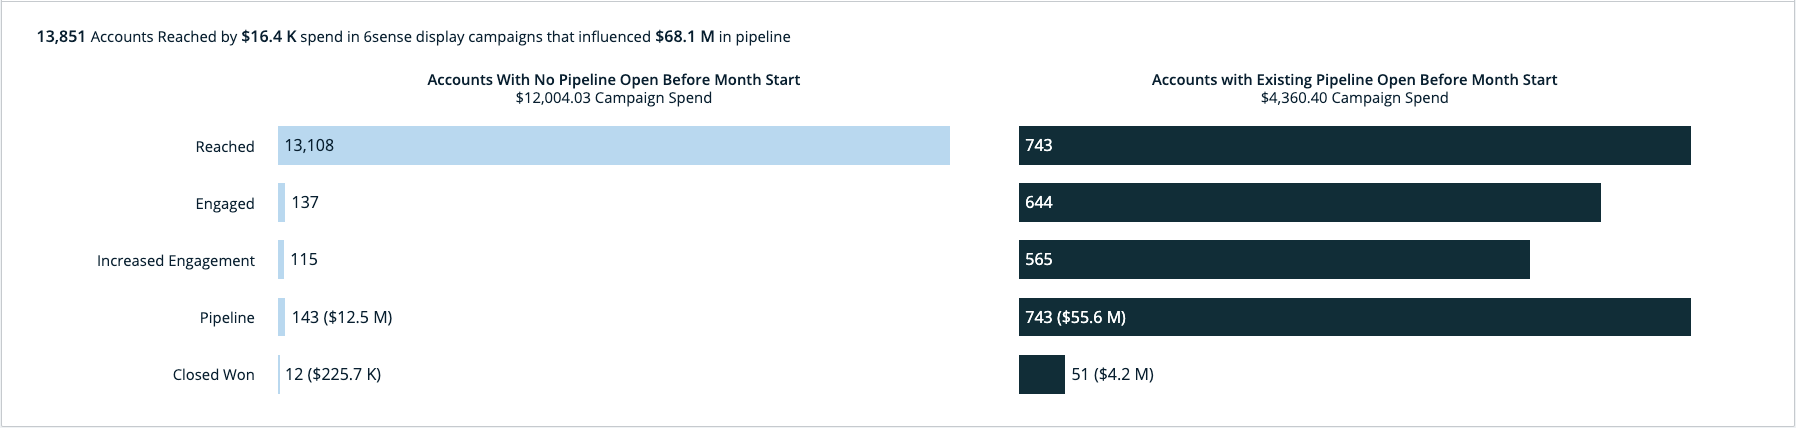
Accounts with no open pipeline before the start of the month
The left chart showcases the effect that 6sense display campaigns have had on in-market accounts, which did not have an opportunity created prior to the start of the selected month.
Because these are net new accounts, customers should not expect that these display campaigns had an immediate effect in progressing users past the “Reached” state.
Accounts with open pipeline before the start of the month
The right chart showcases the effect that 6sense display campaigns have had on accounts that already had opened opportunities prior to start of the selected month.
Because these are accounts that have existing opportunities created on them, customers can expect that these display campaigns have a high impact in driving accounts towards the “Closed Won” state.
Website match rates
Customers that want to understand the strength of A 6sense Company Identity Graph’s ability to associate website activity with a specific account should refer to this visualization.
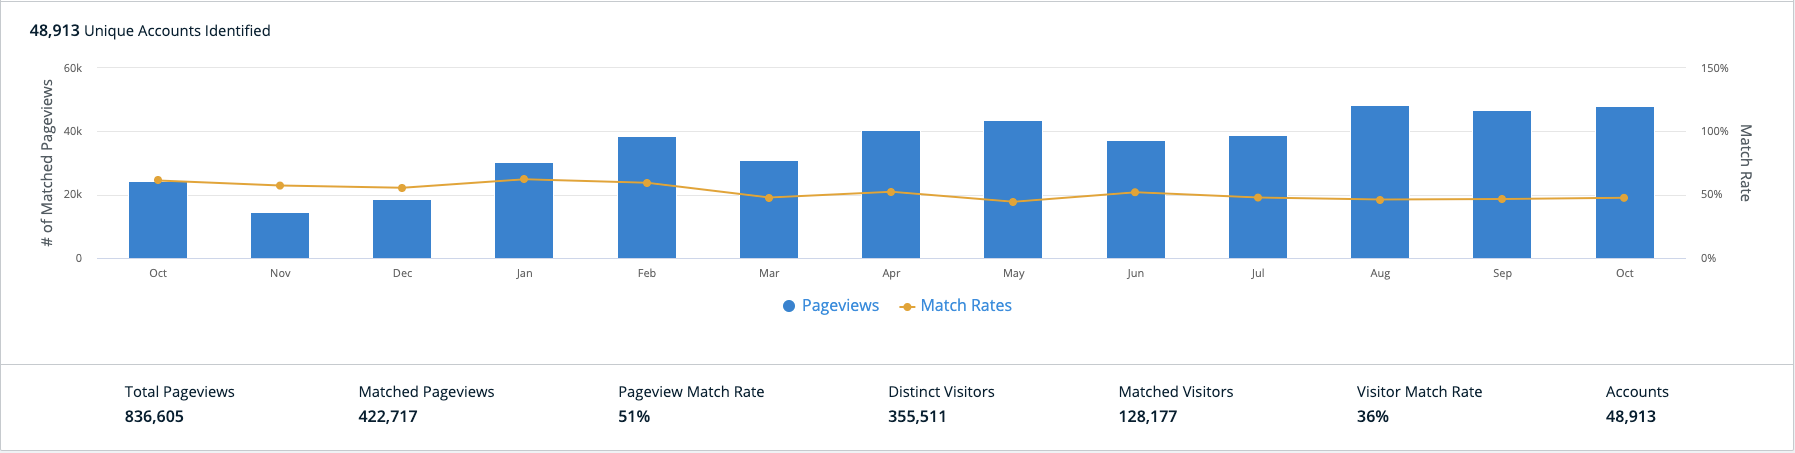
Number of matched pageviews (blue bars)
The number of the customer’s website’s pageviews that 6sense is able to identify with an account.
Customers should expect that their matched page views are equal to their total number of pageviews multiplied by 6sense match rate, described below.
Match rate (orange line)
The percentage of the customer’s website’s pageviews that 6sense is able to identify with an account.
Customers should expect that 6sense match rates are consistently high; this metric can be used to compare the data quality of different account-based engagement vendors.