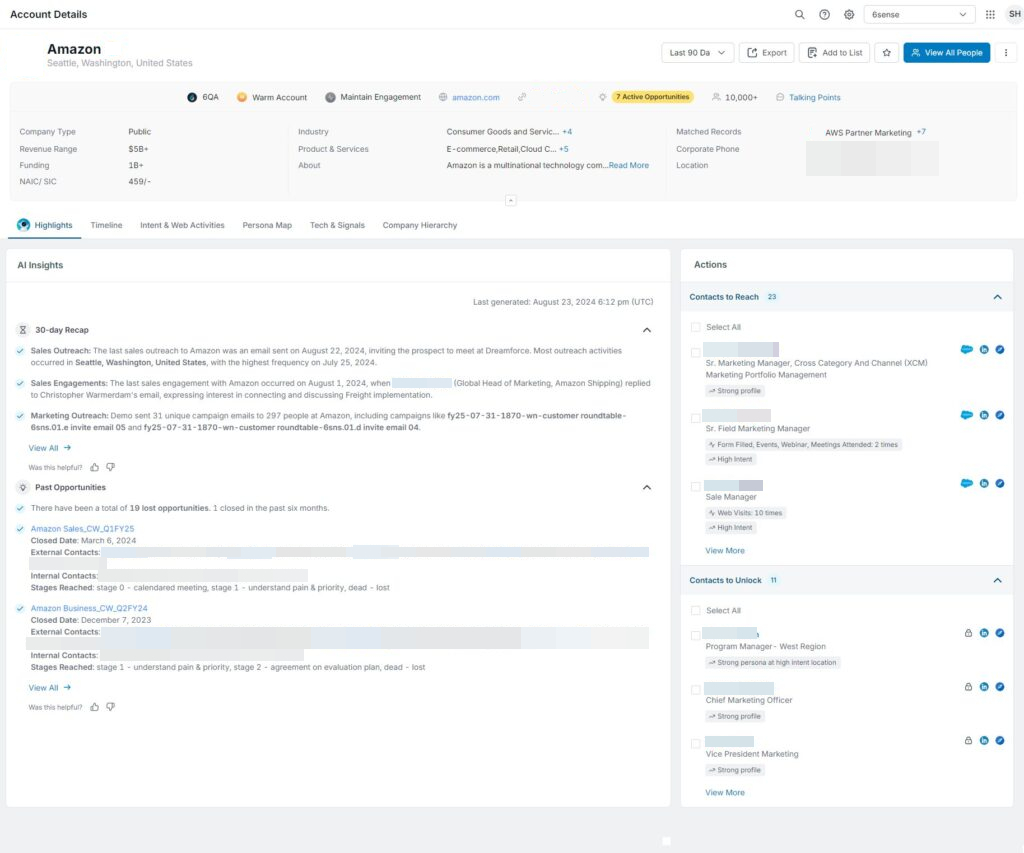
Get the relevant company details to work fast with confidence on our information-packed company details pages. Comprehensive data includes company demographics and information organized in highlights, timeline, web activities, tech & signals, persona MAP, and company hierarchy tabs.
Company Details Page Layout
Company details pages use an information-dense but highly scannable format.
Specific icons denote links to a particular CRM or SEP.
Export actions available differ depending on your integrated CRM or SEP.
Product Dropdown: If your company has set up 6sense for multiple products, you can see a product dropdown in the header area of a page. If you don’t see the dropdown, it means that your company purchased 6sense for only one product or configured 6sense to provide insights on all its products as a whole.
Timeframe Dropdown: The timeframe dropdown lets you select from 7 days, 30 days, 60 days, 90 days, or 180 days. That selection applies to all data displayed on a company details page including the data shown in each tab.
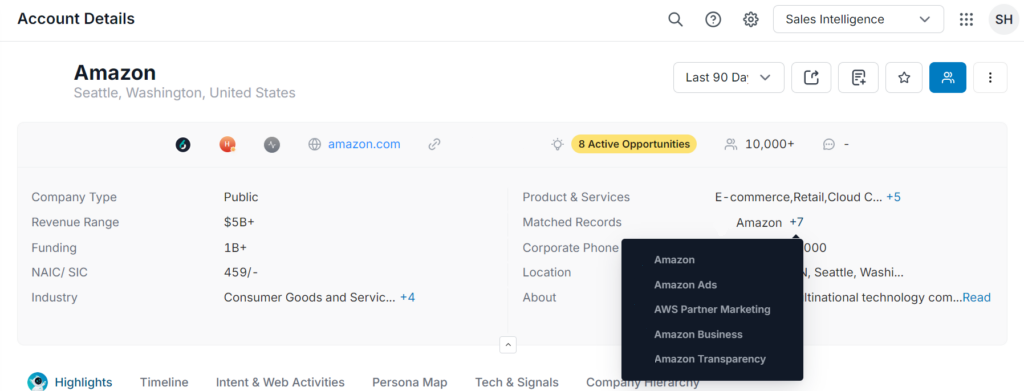
Matched Records (Requires CRM Integration): The entry in the matched record field shows the logo of your integrated CRM and links to the record that matches in your integrated CRM. Click that logo to go to that CRM account page. If there are multiple accounts associated with a match, the number of matches is listed (for instance, “+2”). Hover over that number to see a list of the accounts associated in your CRM and click to any of those listed CRM account pages.
Header Area | Company Overview | Tabs |
|---|---|---|
|
|
|
Highlights Tab Contents
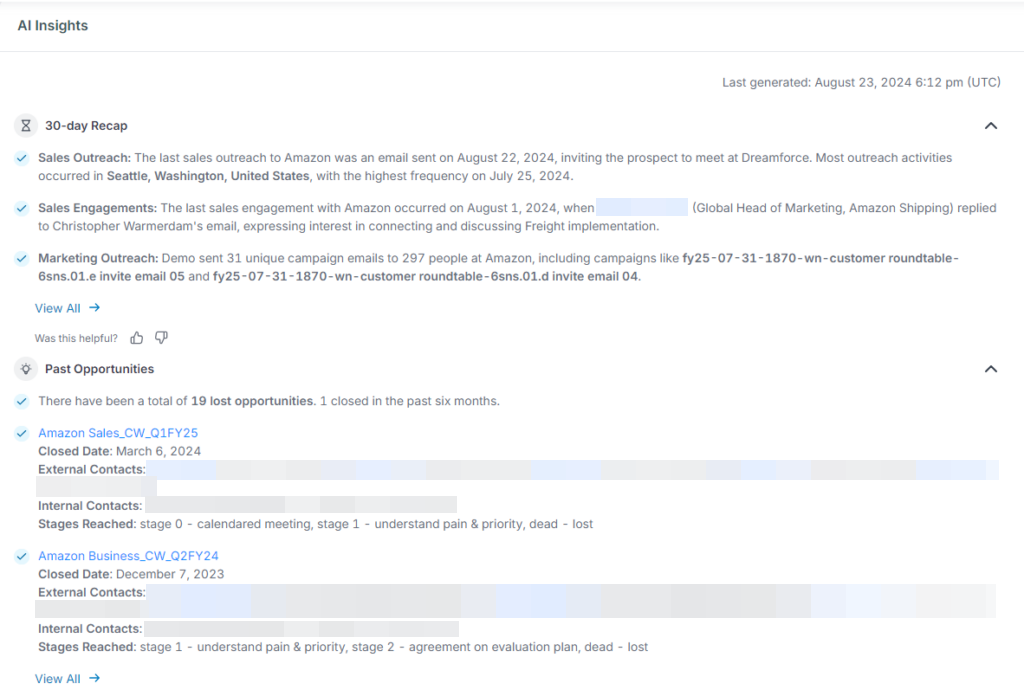
AI Insights
AI Insights shows concise summaries of account activity, including a 30-day recap, past opportunities, key people, and highlights—all in one on the highlights tab.
Actions
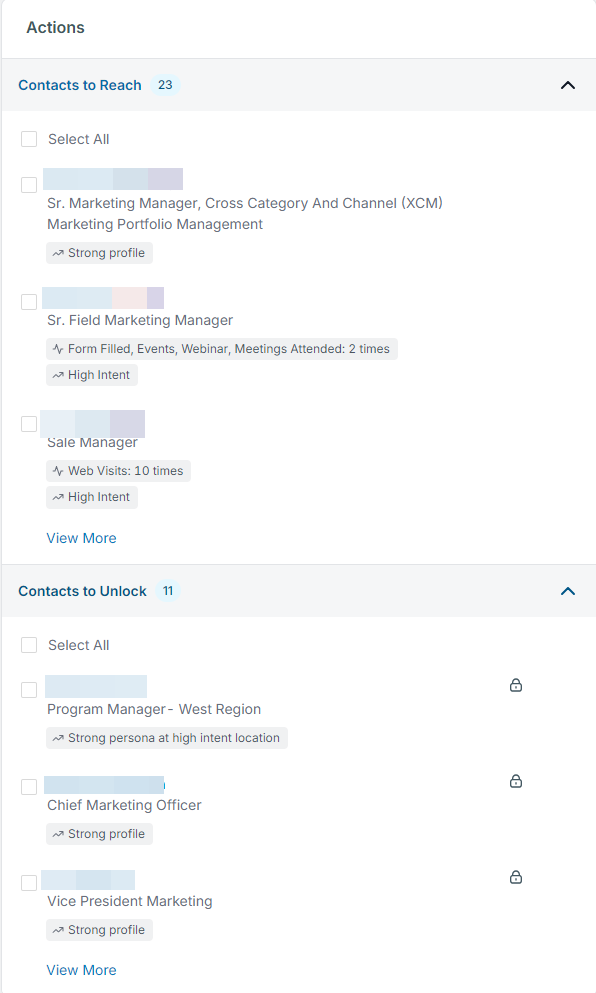
Actions are our suggestions for actions that you should take (based on account temperature, associated signals, and activities) to move an account forward. Actions are a time-saving feature that lets you move fast while being confident that your next move is supported by data.
When you click on an action, the Actions drawer slides open at the left. The action you clicked is highlighted and its details are toggled open for you to review. Explore other actions by toggling them open or closed. Close the drawer by clicking the close icon at the top right.
Learn more about Actions in the Dashboards Overview.
Timeline Tab Contents
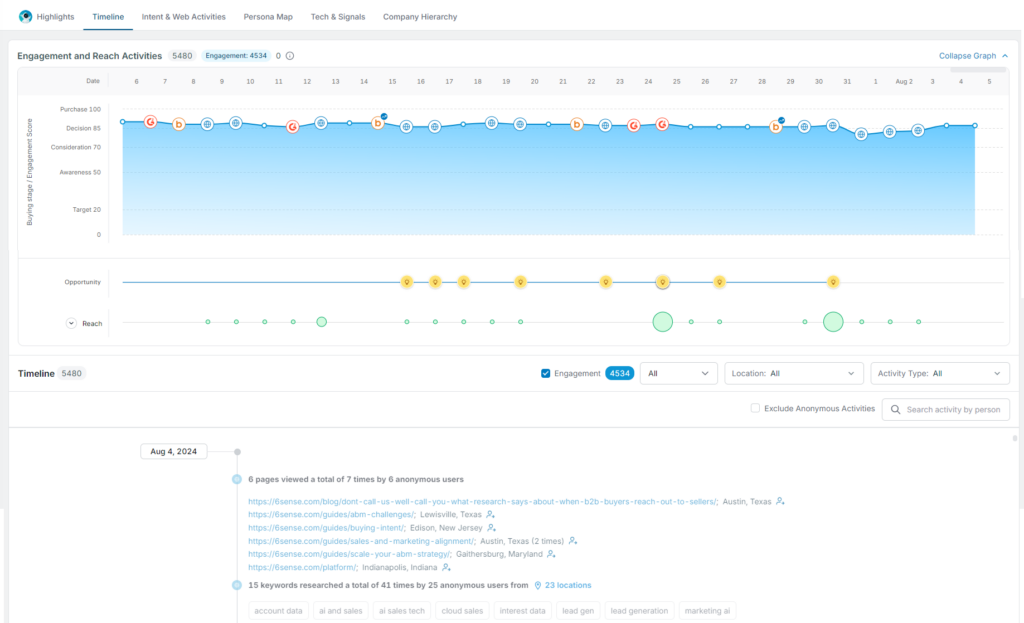
Engagement and Reach Activities
The Engagement and Reach Activities section of this tab displays graphs of engagement activities, account reach activities, and opportunity status. The graphs display a lookback timeframe from yesterday that is set by the timeframe dropdown at the top of the page.
This section may display:
Buying Stage overlay for engagement graph and account reach graph
Engagement activities graph
Engagement score and activities graph
Account reach graph
Opportunity status timeline graph
The activities displayed may include:
Email clicked
Email opened
Email replied
Event attended
Event registered
Form filled
Intent Signal – Peerspot
Intent Signal – Bombora Topic Surged
Intent Signal – G2
Intent Signal – TrustRadius
Invited to meeting
Keyword researched
Meeting attended
Responded
Submitted (anonymous)
Unclassified web activities (anonymous)
Unsubscribed
Video played (anonymous)
Webinar attended
Webpage clicked (anonymous)
Webpage clicked (known user)
Website visited (anonymous)
Website visited (known user)
Timeline
The Timeline section displays a vertical scrollable detailed list of engagement and reach activities.
(See the FAQ section for information on how keywords can affect activities displayed in the Timeline tab.)
You can:
Swap between all engagement activities (default) or all relevant activities.
Turn the display of engagement or reach activities on or off.
Constrain reach activities shown by location.
Refine the timeline to display specific activity types. You can multi-select activity types, but you can only select activities that occurred within the timeframe set.
Exclude anonymous activities with a quick checkbox.
Search activities by person.
Intent & Web Activities Tab Contents
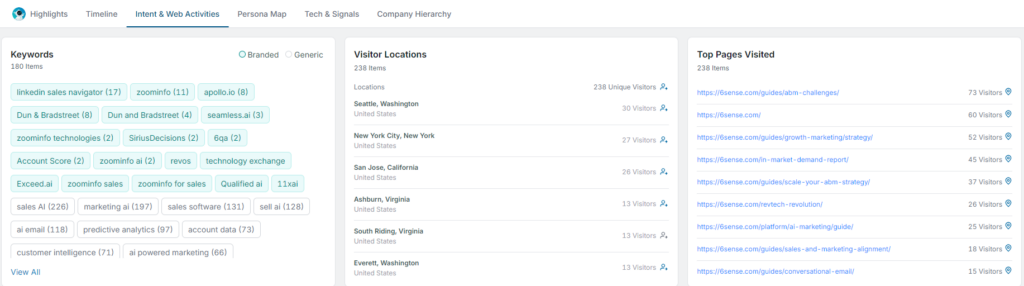
The Intent & Web Activities tab displays a section for branded keywords and one for generic keywords. The keywords are keywords that a visitor on your website associated with this company are searching for on your website or that led them to your website.
The View All link in either keyword section shows a list of the keywords and breaks that list down by number and location.
This tab also shows information about website visitors associated with a company.
Visitor locations are the locations that visitors from this company visited your website from. These may not be the same as physical company work locations.
Top pages visited are the top web pages of your company’s website that visitors from this company visited.
Persona Map Tab Contents
The persona map shows the depth and breadth of your corporate contact coverage. By scanning the distribution of contacts in that grid, you can see:
What coverage you already have in a buying team.
If you have gaps in persona distribution in a buying team.
If you have contact information for key decision maker personas.
Persona Map Cell Icon Legend: The icons shown in a cell of the persona map provide a snapshot of the acquisition of contact information, engagement, and reach about the types of people in that cell. Hovering over the cell offers more information about the breakdown.
Engaged: Contacts that have clicked on emails or ads, filled in forms, done web research related to your product, or otherwise indicated interest in your company or product.
Not Engaged: Contacts that have not indicated interest in your company or product by doing any engagement activity (for example, clicking on emails or ads, filling in forms, or doing web research related to your product).
Not Reached: Contacts that have not been included in marketing activities (for instance, being added to a marketing campaign) nor engaged in sales interactions (for instance, being contacted by sales team members).
To Unlock: Contacts that are net new in your CRM (neither unlocked nor exported in any form).
To Export: Contacts that are already unlocked (either in Sales Intelligence or exported to CSV or to your company’s SEP) but that you have not yet exported to your company’s CRM.
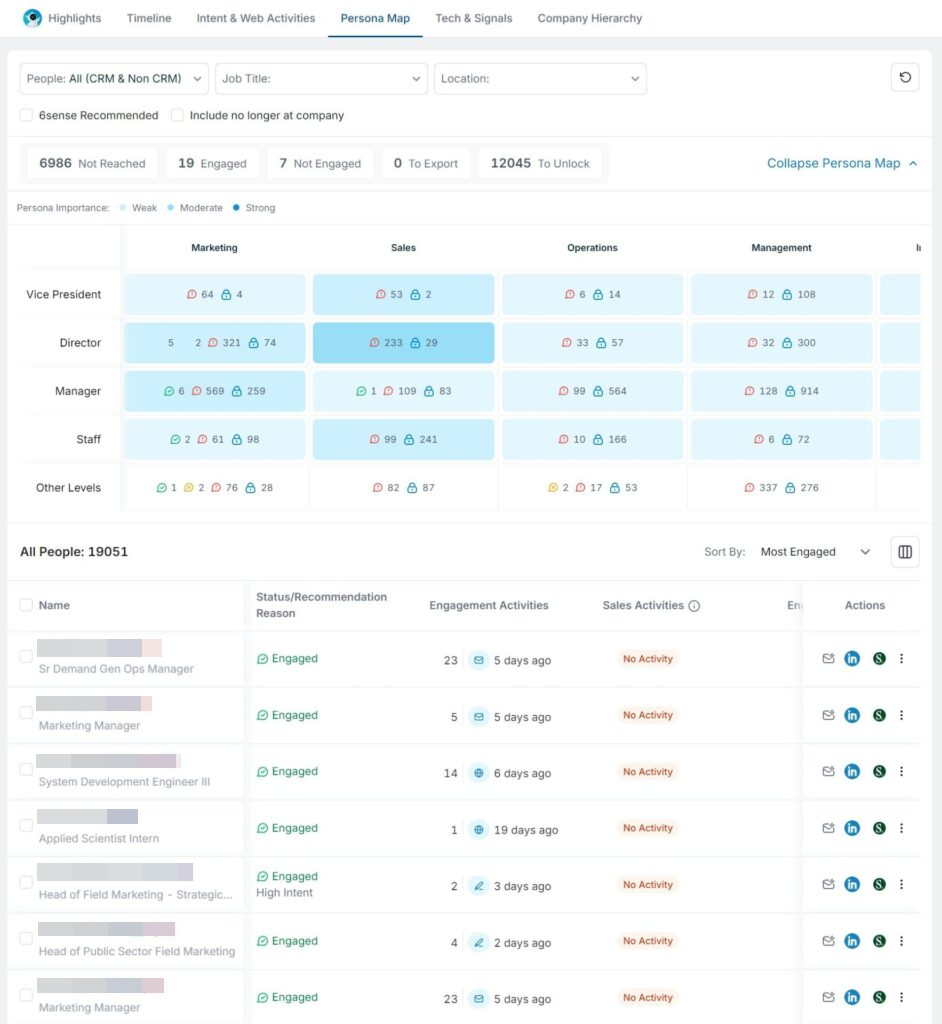
The persona map grid maps a company’s departments (the corporate functions) against a corporate job title hierarchy (personas). The contacts associated with that company are then plotted on that grid.
The grid is color-coded by persona’s importance (weak, moderate, or strong). Persona importance is our assessment of how important this persona is to a typical buying team for a product or service from your company.
You can toggle whether to display contacts no longer in the company and search for people associated with the company. You can also filter the grid and the table below it to show all contacts or those contacts that are engaged, not engaged, not reached, or recommended.
The table below the grid lists all the people associated with a company that are plotted on the grid. The table columns are:
Name
Recommendation reason
Last engagement
Last reach
Status
Engagement trend
Location
You can modify which columns are displayed and their order in the table by using the Modify Columns icon.
You can sort the table by:
Most engaged
Trending people
Last engagement date
Last reached date
Least engaged
Recommended
The grid cells also act as filters on the table. Click a cell to filter the table to display only the people plotted in that cell. Click the cell again to clear the filter.
Each row of the table also offers actions you can take for that contact.
Persona Map Table Actions:
Find on LinkedIn
Find on Sales Navigator
View similar contacts on LinkedIn
View similar contacts on Sales Navigator
View talking points
Export to CSV
Report incorrect data
Tech & Signals Tab Contents
The Tech & Signals tab is broken into sub-tabs for each of its topics: technographics, psychographics, and job postings.
Confidence Score: Each of the items listed in the Technographics or Psychographics sub-tabs includes a percentage-based confidence score. The confidence score lets you know how certain we are about the importance of the item listed based on the data we’ve gathered.
To give you an idea of how the data is derived and how fresh it is, we note the last detected usage for each item. We also let you know what sources we used to assess our confidence rating.
Technographics
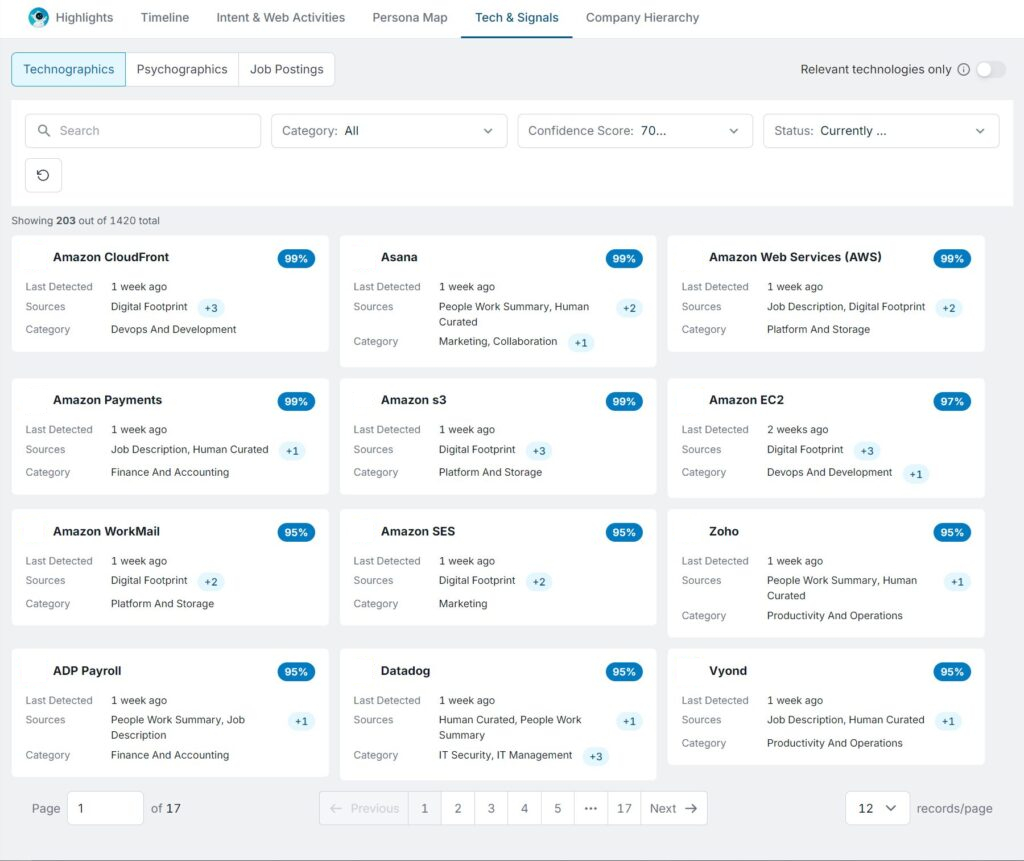
Technographics refer to the technologies used by a company. This includes software, hardware, and other technology solutions.
All technographics are listed unless your administrator has enabled filtering for relevance. If relevance is enabled, you can toggle between all technographics and relevant technographics.
Relevant technographics are chosen by your administrator as relevant to your sales team and organization’s go-to-market strategy.
Use the filters to refine your search by category, confidence score, and status.
The category filter allows you to select specific technology categories to narrow down the results.
The confidence score filter allows you to set a range (for example, 70–100%) to view technographics with a specific confidence level.
The status filter allows you to filter technographics based on their current usage or added in the last x days (30, 60, and 90 days).
Psychographics
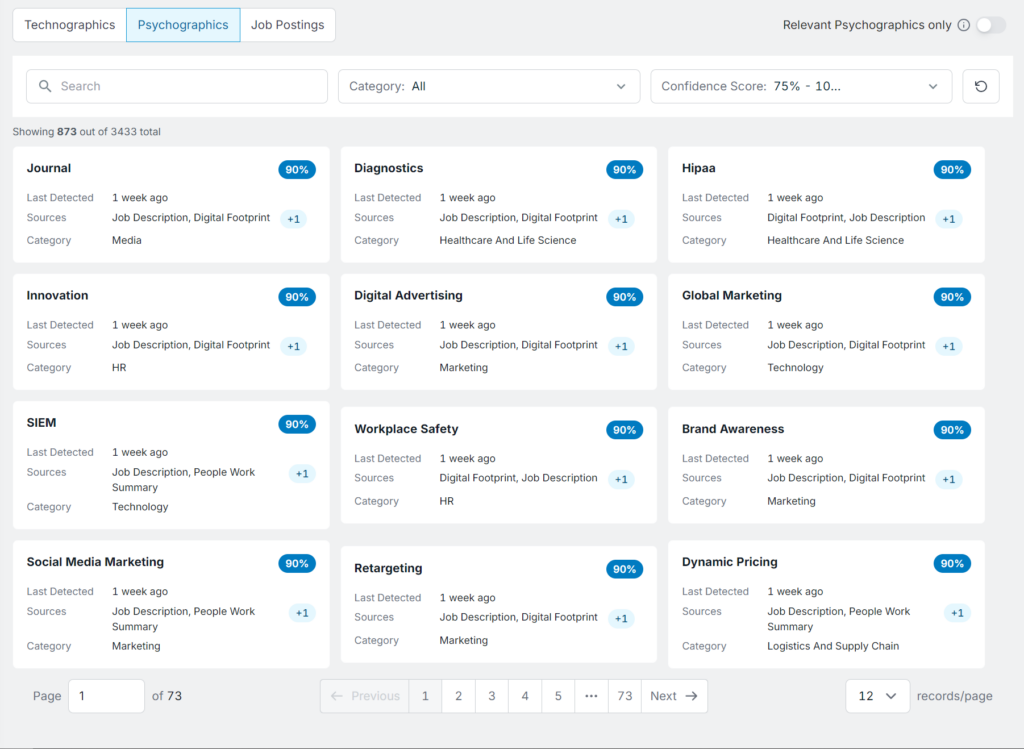
Psychographics are the psychographic attributes of a company that provide insights into a company’s target audience, values, interests, and behaviors.
All psychographics are listed unless your administrator has enabled filtering for relevance. If relevance is enabled, you can toggle between all technographics and relevant technographics.
Relevant psychographics are chosen by your administrator as relevant to your sales team and organization’s go-to-market strategy.
Use the filters to refine your search by confidence score and category.
The confidence score filter allows you to set a range (for example, 75–100%) to view psychographics with a specific confidence level.
The category filter allows you to select specific psychographic categories to narrow down the results.
Job Postings
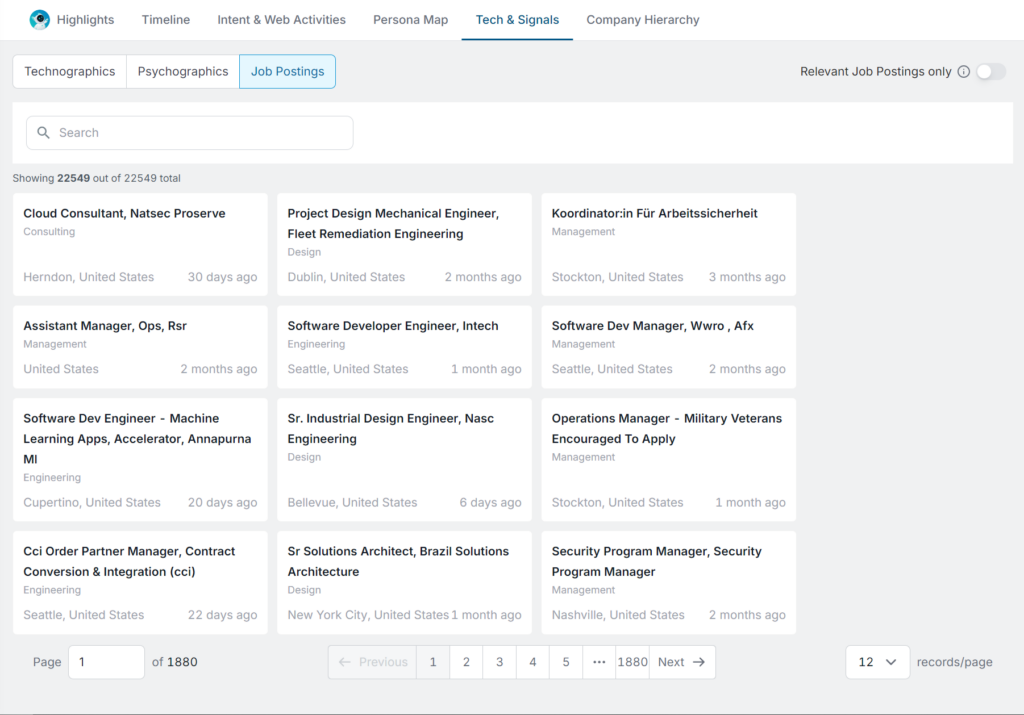
Job postings are listings of available job positions within a company. Here you can view all the job postings that match the settings your administrator has selected.
All job postings are listed unless your administrator has enabled filtering for relevance. If relevance is enabled, you can toggle between all job postings and relevant job postings.
Relevant job postings are chosen by your administrator as relevant to your sales team and organization’s go-to-market strategy.
Use search to refine the job postings displayed.
Company Hierarchy Tab Contents
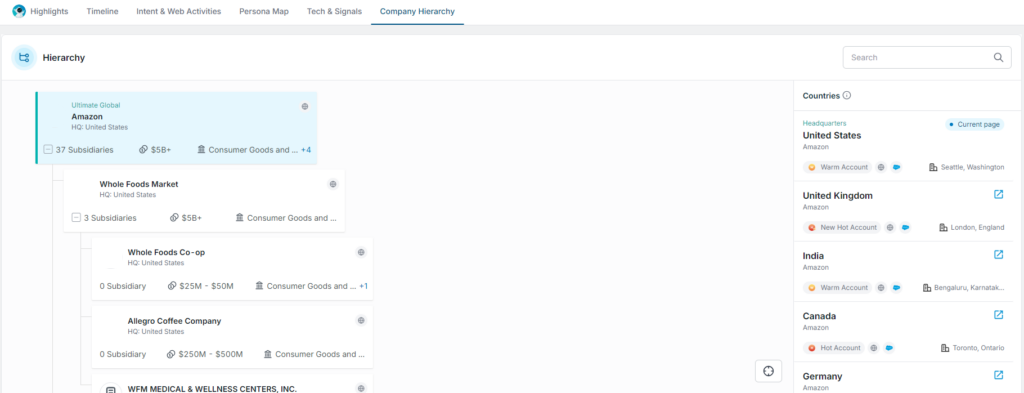
The Company Hierarchy tab displays the relationship of this company with the other acquisitions, subsidiaries, or national or transnational divisions of its parent company. It helps you understand where an organization exists within its own corporate ecosystem. It also helps you trace back where activities in complex companies occur.
The overall parent company always heads the company hierarchy.
You can search a list of all companies that are part of the overall parent company’s corporate hierarchy.
Simple companies are shown as only one card. Each organizational entity of a complex national or transnational company or conglomerate has its own company card.
Lines with collapsible nodes connect the cards to indicate the nested relationships between the company cards.
A simple button returns you to the top of the scrollable list.
Company Card Information: Each company card lists:
The territory that the company is the headquarters of
How many subsidiaries the company has
The company’s revenue range
They company’s industry (and sub-industries)
A link to the company’s website
Countries Column: The Countries column displays information relevant to the active (selected) company card. You can open any location’s company details page listed in the Countries column as a separate tab.
The locations listed in the Countries column are the cities and countries where we have noticed activities or noticed people. Those locations may be different from physical offices.
A current page tag notes when a company listed in the Countries column matches the company details page you are on.
FAQ
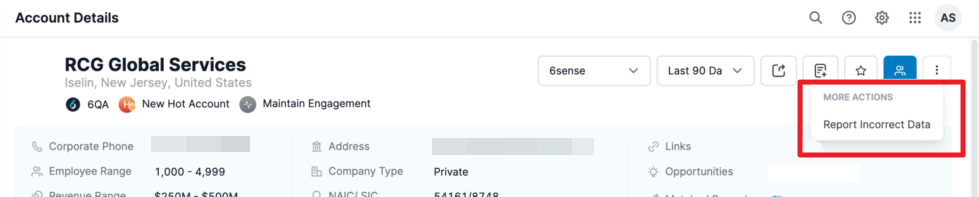
Q: If I see incorrect firmographic data, can I provide feedback to make a change?
A: If you see incorrect data within the 6sense Sales Intelligence platform, you can provide feedback to help improve the Master Company Database using the “Report Incorrect Data” option under more actions. Users can provide feedback on the following fields:
Company Name
Company Website
Employee Range
Industry
Revenue Range
Location
Q: What happens to my feedback after I submit?
A: We take all our customer feedback very diligently. Each feedback is reviewed by our team of analysts and if accepted, it goes into our regular data update cycle before showing up in the Platform. Based on the scope of the change, this could be monthly or quarterly.
We do not provide responses to individual feedback as that is not scalable. Please do not open support tickets for status inquiries at this time as this feedback goes directly to our product team.
Q: It seems like the actions displayed in the timeline are wrong (missing or inconsistent). Why are active keywords not influencing my predictive model?
A: We often get questions about why actions appear or do not appear in the timeline. We filter out “noisy” and contextually inappropriate keyword sources, both in general and in relation to the model we set up for your company for its product. Active keywords are excluded (and so don’t influence) your predictive model when (in context) we feel they misrepresent what was intended by capturing useful keyword information. This exclusion increases the accuracy of your model’s behaviour and improves the quality of the data of your target accounts.