The Opportunity Trends report reviews created opportunities and helps you understand their value over time. You can measure how activations and target segments contribute to new opportunities and pipeline. The report answers questions such as:
How much pipeline are your programs creating over time?
Which target accounts are turning into opportunities?
Which segments and activations are most effective at driving pipeline?
In addition, you can download the full data set, including opportunities and accounts, with all the important IDs.
Prerequisites
All ABM users in 6sense can view the report. View-only users cannot download the report.
SI users must be Primary or Sales Administrators to view the report; Sales SDR and AE users cannot access the report.
This report requires that your CRM is integrated with 6sense.
Access the Opportunity Trends report
To access the report:
Go to ABM > Reports.
Select Opportunity Trends.
Alternatively, from the Revenue Marketing Home Page select New opportunities or New pipeline from the Highlights panel.
Opportunity Trends dimensions
At the top of the report you can adjust various dimensions that affect every chart in the report.

Time dimension: Use the menu to group the time by day, week, month, or quarter.
Scope: Either all accounts in your system or an individual segment.
Product/Predictive model: If you have more than one Predictive model, you can select which one to use.
Report header data and options
The report header shows the total number of accounts and the date range of the report.

The headers include controls to:
Filter the results by:
Exclude $0 opportunities
Exclude irrelevant opportunities
Opportunity status
Opportunity stage
Opportunity type
Segment
Profile fit - requires the Predictive add-on
From 6QA - requires the Predictive add-on
Change the date range, for up to two years. (Two years is our data retention policy.)
Save the report.
Copy a link to the report.
The following section is a Performance chart, then an Activity details table.
Use the filters and menus to adjust the metrics displayed in the report, as described in the following sections.
Performance chart
The Performance chart shows the trend of two metrics over time.
Use the two menus on the right of the Performance trend chart to review the relationships between two metrics. By default the chart compares new pipeline versus new opportunities. Options include:
New pipeline
Average opportunity value
Accounts with opportunities
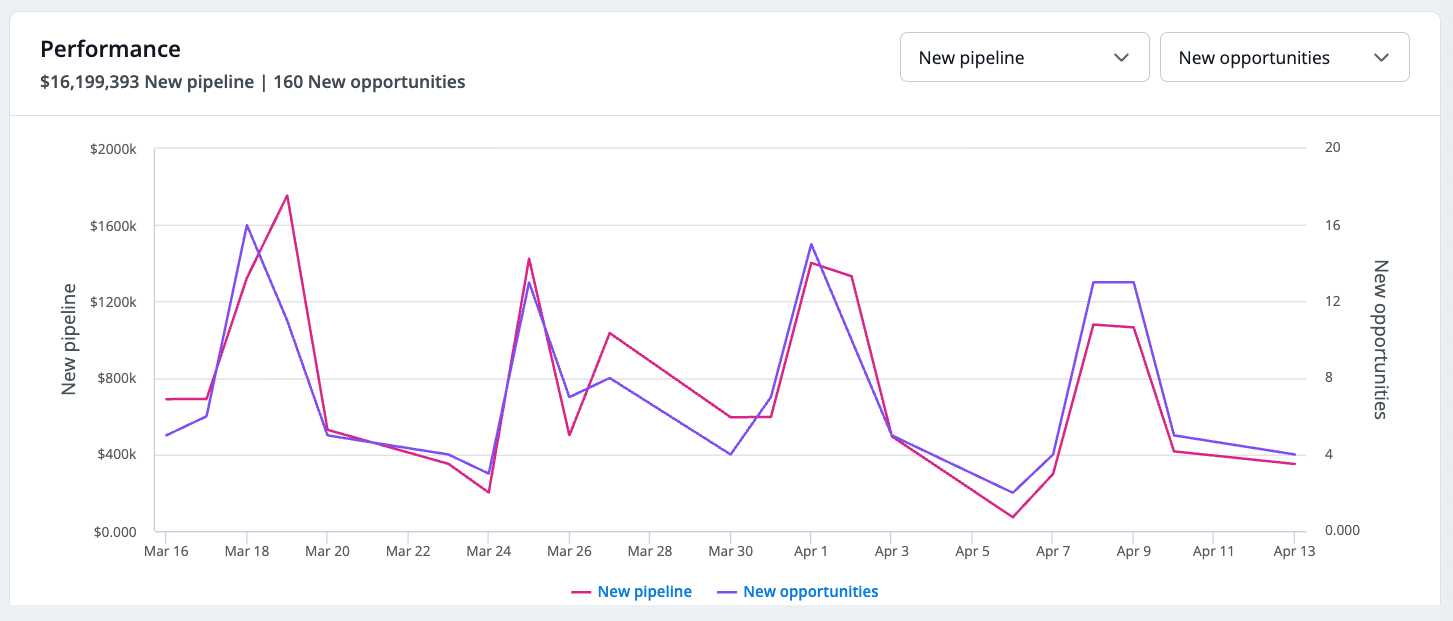
Use the GROUP menu to group data by day, week, month, quarter, or year.
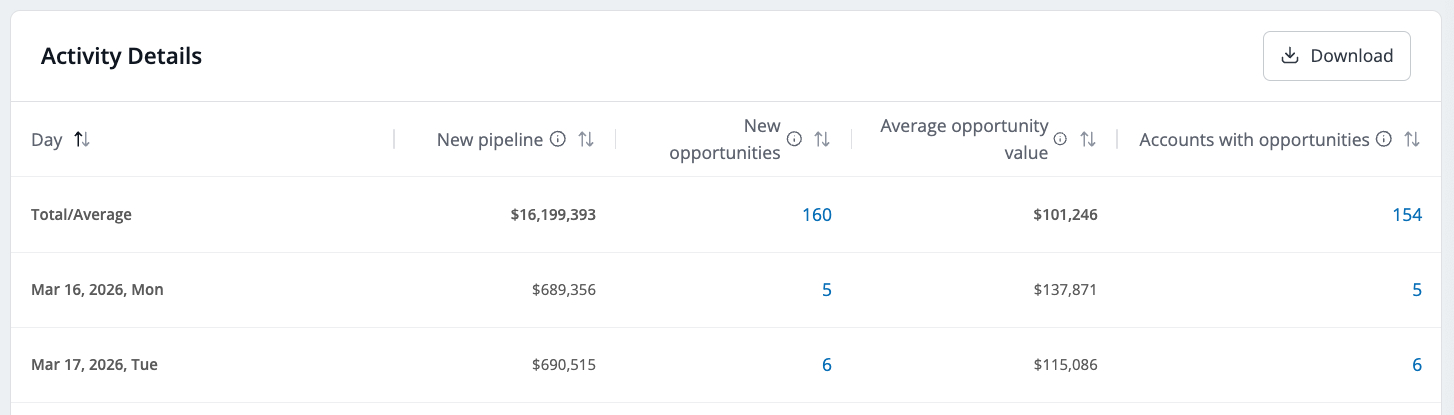
Activity details table
The Activity details table lists metrics on a daily basis, including:
Dollar value of new pipeline opportunities created during the time period.
Total number of new opportunities created during the time period. Select the number in this column to drill down to the New pipeline account details list.
Average value of opportunities in the selected time period.
Total number of accounts with new opportunities created during the time period. Often this number is the same as the total number of new opportunities, however an account may have more than one new opportunity. Select the number in this column to drill down to the Accounts with opportunities details list.
New opportunities account details list
In the Activity Details table, select the number in the New opportunities column to open the new pipeline account details list. It shows:
Total number of new opportunities
Name
Account name: Select the link in this column to open the account’s detailed information page.
Stage
Status
Type of account: upsell, renewal
Dollar amount
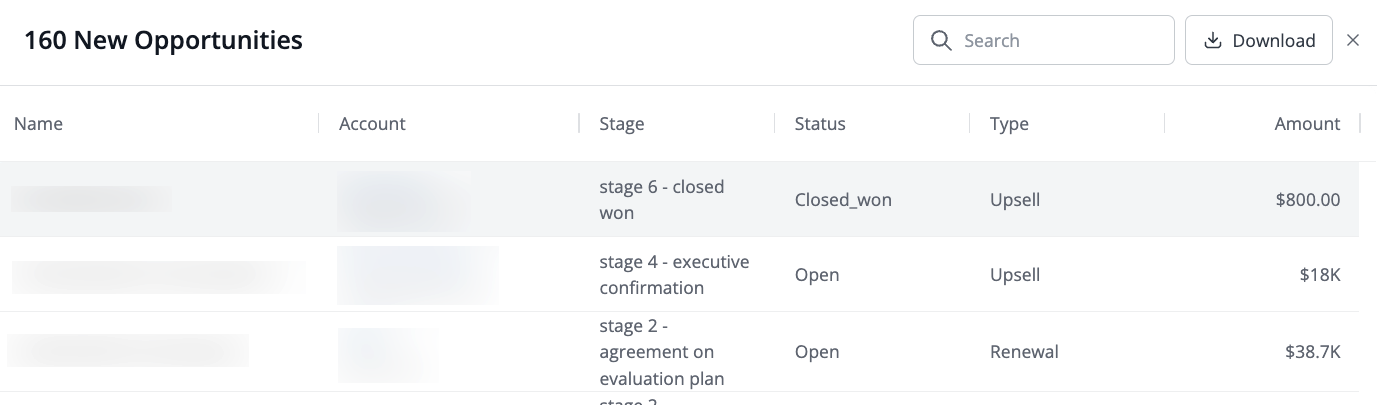
You can search the list, and download it as a CSV file.
Accounts with opportunities details list
In the Activity Details table, select the number in the Accounts with opportunities column to open the new pipeline account details list. It shows:
Total number of new opportunities
Account name: Select the link in this column to open the account’s detailed information page.
Location
Employee range
Revenue range
Industry
.png)
You can search the list, and download it as a CSV file.
Document changelog
May 12 2026: First published