Use the Advertising Campaign Details > Performance tab to review:
Spend and delivery pacing: How your campaign is spending budget compared to expectations for the current delivery timeframe.
Highlights: Key campaign outcomes, where you can select and view the accounts associated with a metric.
Campaign performance: Metrics related to ad delivery and interaction.
Performance trend: A time‑series chart showing how selected campaign metrics change over time.
Account journey: How accounts progress through different stages after being reached or engaged by the campaign.
Increased buying stages: Accounts whose buying stage advanced after being influenced by the campaign.
New 6QA: The accounts that became newly qualified after being influenced by the campaign.
The Performance tab is the default view in the Advertising Campaign Details page.
Tip: Use the delivery timeframe filter at the top right to focus the results. By default the tab displays data from the entire lifetime of the campaign. You can narrow it to the last 7 or 30 days, or set a custom date range.
Also refer to the Advertising Performance Trend Report.
Spend and delivery pacing panel
The Spend and delivery pacing panel shows how your campaign is spending budget compared to expectations for the current delivery timeframe. In addition to showing spend and delivery status, this panel may display an Optimize option to help you take action when a campaign is not pacing as expected. The panel updates based on how your campaign pacing.
.png)
Delivery pacing status
Delivery status tells you whether the campaign is pacing as expected based on how much budget you’ve spent compared to how much you were expected to spend by this point in the flight.
Campaign spend amount
Spend is the amount spent from the configured budget since the campaign start or within the selected dates.
Days left in campaign
Days left in campaign is the number of days remaining in the campaign. The value rounds up partial days.
How pacing is calculated
Delivery pacing calculations use a Budget Exhaustion Rate (BER):
BER = Actual delivery / Expected delivery × 100
Delivery states include:
Over delivery: greater than 110%
Steady delivery: 85%–110% of expected spend
Under delivery: 50%–85%
Low delivery: less than 50%
Campaign Optimize option
The Optimize option appears in the Spend and delivery pacing panel only when the campaign needs attention based on delivery pacing. It appears when the campaign status is:
Low delivery
Under delivery
Over delivery
When you select Optimize, 6sense surfaces recommendations based on the campaign’s delivery pattern and configuration. These recommendations are designed to help you correct pacing issues before delivery is impacted further.
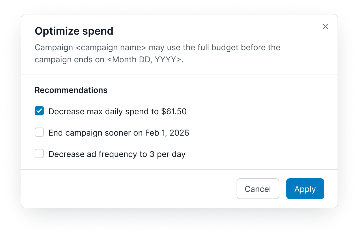
You won’t see Optimize when the campaign is delivering normally, such as:
If the campaign is in Steady delivery, Optimize does not appear.
If the campaign is completed, deactivated, or budget exhausted, Optimize does not appear.
Highlights panel
.png)
The Highlights panel shows a snapshot of key campaign outcomes, where you can select and view the accounts associated with a metric.
To view account highlights:
Select a metric card, such as Accounts reached, Accounts engaged, or New 6QAs.
The account list opens and displays the accounts associated with the selected metric.
Use Search to find specific accounts or Download to export the account list.
By default, Highlights displays a set of 5 metrics from the following list. You can customize which metrics appear to match what you want to focus on.
Accounts reached: Number of unique accounts served at least one ad impression.
Accounts engaged: Number of unique accounts that have clicks or view-throughs.
Account engagement rate: Percentage of reached accounts that engaged.
Newly engaged accounts: Accounts that engaged for the first time after seeing the campaign.
Accounts with increased engagement: Accounts whose engagement increased compared to before the campaign.
Increased buying stages (reached): Accounts that moved to a higher buying stage after seeing an ad.
Increased buying stages (engaged): Accounts that moved to a higher buying stage after engaging with an ad.
New 6QAs (reached): Accounts newly qualified after seeing an ad.
New 6QAs (engaged): Number of accounts that became newly qualified within 30 days of engaging with a campaign.
Reached with opportunities: Reached accounts that already have an open opportunity.
Engaged with opportunities: Number of engaged accounts associated with an open opportunity.
New pipeline: Total value of opportunities opened within 30 days of an account being served an impression.
Influenced form fills: Form submissions from accounts that saw an ad before converting. You can view more details on these form fills in the Influenced Form Fills Report.
Customize Highlights metrics
The Highlights panel displays 5 metrics at a time. You can customize the Highlights section by selecting which metrics you want to see. Customize Highlights when you want to:
Quickly review different aspects of campaign performance
Focus on short‑term delivery vs long‑term outcomes
Align the view with specific reporting or stakeholder needs
Editing Highlights does not affect other sections on the page, such as Performance Trend or Account Journey.
To edit Highlights:
In the Highlights section, select Edit.
Choose up to 5 metrics from the list.
Select Save to apply your changes.
Highlights immediately updates to reflect your selection and the active filters. All selected metrics:
Respect the delivery timeframe filter (Lifetime, Last 7 Days, Last 30 Days, or Date Range).
Update automatically when filters change.
Campaign performance panel
The Campaign performance panel displays metrics related to ad delivery and interaction for the selected delivery timeframe. All data shown in this panel updates based on the active delivery timeframe and applied filters.

The Campaign performance panel includes:
Impressions: Count of impressions gathered by the campaign.
eCPM (effective cost per mille/thousand): Cost incurred for procuring 1000 ad impressions.
Clicks: Count of clicks during the campaign flight.
CTR (click‑through rate): Percentage of ad click-through generated out of matched ad impressions served for a campaign.
eCPC (effective cost per click): The amount you’ve paid for your campaign divided by its total clicks.
Account CTR: Accounts reached where visitors came to your website by clicking through an ad, compared to total accounts reached.
Account VTR: Accounts reached where visitors came to your website within 30 days of an impression The percentage of reached accounts that visited the website within 30 days of an impression without clicking through an ad, compared to total accounts reached.
Viewability: Percentage of ad impressions that were measured as viewable by the user.
Video (CTV) performance metrics
If the Advertising campaign includes video or CTV ads, additional video‑specific metrics display in the Campaign performance panel, including:
Midpoints: The number of video ads watched at least halfway.
Completions: The number of video ads watched to completion.
Completion rate: Completions as a percentage of impressions.
CPCV (cost per completed view): The average cost per completed video view.
Where CTV ads run
CTV ads run across premium streaming services, devices, and networks. Inventory is supplied through direct partnerships and private marketplace (PMP) deals. Expanded inventory is now available globally through PMP deals, particularly in EMEA and APAC, improving reach and performance outside the US.
Conversion influence
This part shows downstream conversion activity associated with ad exposure. It includes, Influenced form fills, which show the number of form submissions from accounts that saw an ad before the form fill occurred.
Performance trend chart
Performance trend is a time‑series chart showing how selected campaign metrics change over time. The chart updates based on the selected delivery timeframe and applied filters.
.png)
The Performance trend chart displays one or more metrics as trend lines:
Each line represents a selected metric (for example, Spend or Impressions).
The legend indicates which metrics are currently displayed.
Change the Performance trend chart metrics
You can change the metric displayed in the Performance trend chart using the dropdown in the section header. Depending on the campaign setup, available metrics may include:
Spend
Impressions
Other delivery or interaction metrics supported by the campaign
When you select a different metric, the chart updates to reflect that metric across the selected timeframe.
Performance trend chart data behavior
Data points represent values aggregated by day.
All values shown reflect activity that occurred within the selected delivery timeframe.
Changing the delivery timeframe refreshes the entire chart.
Performance trend data is informational and does not affect metrics shown in other sections.
Account journey chart
The Account journey chart shows how accounts progress through different stages after being reached or engaged by the campaign. This section displays account‑level movement across buying stages and qualification states during the selected delivery timeframe. All data updates based on the active Delivery timeframe and applied filters.
.png)
Pipeline association in the Account journey chart
When available, the Account journey section also shows pipeline‑related data tied to influenced accounts. This includes:
Accounts associated with open opportunities
Pipeline created after accounts were reached by the campaign
Drill down to view account details
Select a bar in the Account journey chart to view the accounts associated with that stage of the journey. The account list displays only the accounts represented by the selected bar.
Increased buying stages chart
The Increased buying stages chart shows accounts whose buying stage advanced after being influenced by the campaign. This metric provides two variants, based on how the account was influenced. Use the menu at the top right of the chart to select either:
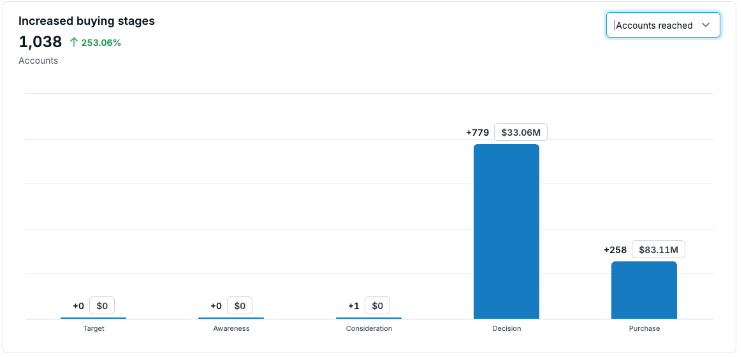
Accounts reached: the number of accounts whose buying stage increased after being reached by the campaign. An account is considered reached when it is served at least one ad impression. Buying stage changes are evaluated within a defined period after the impression event. Each account is counted once using the highest buying stage reached during the evaluation window.
Accounts engaged: The number of accounts whose buying stage increased after engaging with the campaign. An account is considered engaged when it meets the engagement criteria defined for the campaign (for example, ad interaction followed by a site visit). Buying stage changes are evaluated within a defined period after the engagement event. Each account is counted once using the highest buying stage reached during the evaluation window.
Drill down to buying stage
Select a buying stage in the chart to view the accounts associated with that stage. The account list displays accounts that contributed to the selected buying-stage segment.
New 6QA chart
The New 6QA chart shows the accounts that became newly qualified after being influenced by the campaign. This metric has two variants, depending on how the account was influenced. Use the menu at the top right of the chart to select either:
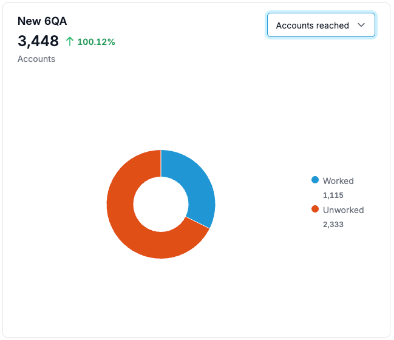
Accounts reached: The number of accounts that became newly qualified after being reached by the campaign.
An account is considered reached when it is served at least one ad impression. Qualification is evaluated within a defined period following the impression. Each account is counted once.
Accounts engaged: The number of accounts that became newly qualified after engaging with the campaign.
An account is considered engaged when it meets the engagement criteria defined for the campaign. Qualification is evaluated within a defined period following the engagement. Each account is counted once.
Drill down to 6QA worked and unworked accounts
Select a segment in the New 6QA chart to view the associated accounts. The account list displays accounts represented by the selected qualification category.