The new Advertising Dashboard in 6sense delivers actionable insights and performance data to help advertisers maximize the value of their campaigns. This dashboard provides a comprehensive view of highlights, performance trends, account journeys, and other key metrics, enabling users to easily demonstrate the impact of their advertising efforts.
Key Benefits
Prove Value: Quickly showcase the effectiveness of your 6sense ads.
Gain Insights: Access detailed information about your advertising program, with links to deeper reporting.
Support Teams: Internal teams can better understand customer usage and support use cases.
.png)
Access the Advertising Dashboard
All users with an ABM license can access the ABM Advertising Dashboard.
To access the Advertising Dashboard, go to ABM > Advertising and click the Dashboard tab.
Tip: If you don’t see any metrics, perhaps you haven’t run any campaigns yet. Run advertising campaigns to start populating the metrics.
Above the Advertising Dashboard
At the top of the Advertising Dashboard you can see the UTC time when it was last updated. There’s also a handy link to the Performance Trend Report.
You can access the other tabs of the Advertising page:
Campaigns: A list of all your campaigns. See Campaigns List View.
Ads Library: A library of your saved ads. See FAQ: Ads Creation.
segment Syncs: A list of all your Segment syncs. See Segment Sync Management.
Advertising Dashboard tab
The Advertising Dashboard tab shows the number of campaigns run over the selected time period, and has controls for the data that appears in the metrics panels below.
When you change the metric settings in the Advertising Dashboard, 6sense saves your changes to your profile so that you won’t have to redo them again.
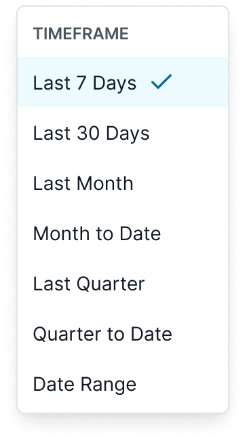
Set the time period for campaigns to evaluate
The page shows the number of campaigns run over the selected time period. Click the Last 30 Days dropdown to change the time period.
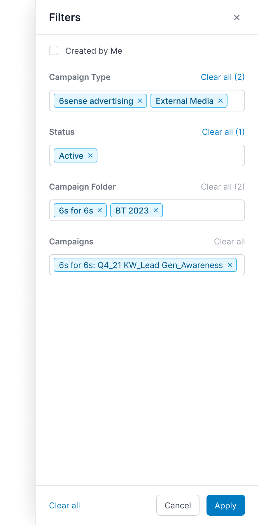
Filter which campaigns to evaluate
Marketers can apply campaign and time-range filters to customize the dashboard view.
Benefits:
View data relevant to selected campaigns and time periods.
Instantly update dashboard metrics based on filter criteria.
Quickly identify valuable data for quarterly business reviews (QBRs).
Features:
Filter by campaign type, status, folder, and specific campaigns.
Apply or clear filters with a single click.
Advertising Dashboard metrics panels
The Advertising Dashboard has multiple panels that show different performance metrics.
Highlights KPIs
Provides a snapshot of top key performance indicators (KPIs) across campaigns and channels.
Benefits:
Focus on the metrics that matter most.
Compare current performance to previous periods.
Instantly see trends in spend, eCPM, CPC, accounts reached, accounts engaged, and engagement rate.
Features:
Select up to six metrics to display.
Visual indicators show improvement or decline compared to prior periods.
.png)
Click Edit at the top right to change the displayed metrics.
Drill down to account-level details
You can now select Accounts targeted, Accounts reached, and Accounts engaged to view the list of accounts included in each metric.
In Highlights, select any of the three metrics to open the account list.
In Account journey, select any metric value to open the account list for that stage.
.png)
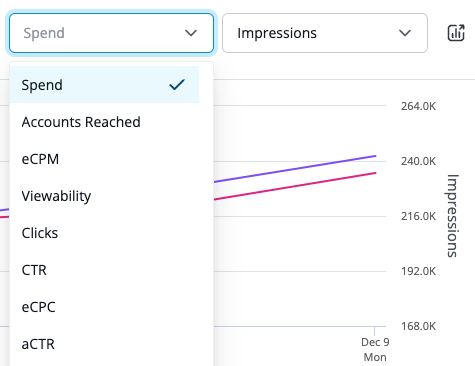
Performance Trend chart
Visualize how performance metrics change over time.
Benefits:
Analyze two metrics simultaneously to understand relationships.
Identify peaks and troughs for deeper investigation.
Support highlights with detailed trend analysis.
Features:
Plot any two metrics for custom analysis.
Interactive chart for time-based exploration.
.png)
You can use the pulldown menus at the top right to change the metrics to be compared. There’s also a button that goes to the Performance Trend Report.
Account Journey chart
The Account Journey chart show the relation between your advertising targeted, reached, and engaged accounts. Check the reach rate to ensure it’s over 80% for proper segment penetration. Leverage the engagement rate to see how well your content messaging is received by your reached audience.
Benefits:
Understand reach and engagement rates.
See how engaged accounts convert to opportunities and closed-won deals.
Get a high-level summary of account-based marketing (ABM) advertising outcomes.
Features:
Visual breakdown of targeted, reached, and engaged accounts.
Metrics for reach rate and engagement rate.
.png)
Hover over the bars to see more details. Click the icon at the top right to see the Performance Trend By Account report.
Drill down on Account Journey metrics
All Account Journey metrics now support drill‑down.
Select:
Accounts targeted to see the full set of targeted accounts
Accounts reached to view accounts that saw impressions
Accounts engaged to identify which accounts interacted with your ads
Distribution by Campaign Types chart
Assess performance and coverage across different campaign types.
Benefits:
Identify which channels are most and least effective.
Optimize campaign strategy based on channel performance.
Features:
Pie chart visualization of impressions by campaign type.
.png)
Use the Impressions dropdown to change the filter to:
Impressions (default)
Budget
Clicks
Accounts Engaged
Click the icon at the top right to see the the Performance Trend By Campaign Type report.
Distribution by Geography
The Distribution by Country chart provides insight into performance and coverage across your targeted countries. This is based on the 6sense mapped country to the targeted identifier (such as the IP address).
.png)
Use the Impressions dropdown to change the filter to:
Impressions (default)
Spend
Clicks
Accounts Engaged
Click the icon at the top right to see the the Performance Trend By Geography and Country report.
Campaign Performance metrics
Review the performance of top campaigns for selected metrics.
Benefits:
Identify best and worst performing campaigns.
Link directly to the campaign list page for further analysis.
Features:
Bar chart of campaign performance by metric.
.png)
Use the Impressions dropdown to change the filter to:
Impressions (default)
Spend
Clicks
Budget
eCPM
Viewability
CPR
eCPC
aCTR
Accounts Engaged
Use the Sort icon to change the sort order of the bar chart.
Click the icon at the top right to see the the Performance Trend By Campaign and Individual Campaign report.
Ads Performance metrics
Determine which ad creatives performed best for a selected metric.
Benefits:
Optimize creative strategy based on engagement and other metrics.
Identify top and bottom performing ads.
Features:
Bar chart of ad performance by metric.
.png)
Use the Impressions dropdown to change the filter to:
Impressions (default)
Spend
Clicks
eCPM
CPR
eCPC
aCTR
Viewability
Use the Sort icon to change the sort order of the bar chart.
Click the icon at the top right to go to the Ad Library.
Segment Performance metrics
Analyze performance by audience segment.
Benefits:
Discover top and bottom performing segments.
Link to the Audiences report for detailed insights.
Features:
Bar chart of segment performance by metric.
.png)
Use the Accounts Reached dropdown to change the filter to:
Accounts Reached (default)
Impressions
Spend
Clicks
eCPM
CTR
eCPC
aCTR
Use the Sort icon to change the sort order of the bar chart.
Click the icon at the top right to see the the Performance Trend By Segment and Individual Segment report.
Account Performance
Identify which accounts performed best based on a single metric.
Benefits:
Focus on high-value accounts.
Optimize targeting and engagement strategies.
Features:
Bar chart of account performance by metric.
.png)
Use the Impressions dropdown to change the filter to:
Impressions (default)
Spend
Clicks
eCPM
CTR
eCPC
Viewability
Use the Sort icon to change the sort order of the bar chart.
Click the icon at the top right to see the Performance Trend by Account report.