The Revenue Marketing Home page is new! It replaces the ABM Dashboard.
The Revenue Marketing (formerly ABM) default Home page provides visualizations of 6sense performance metrics. It contains various panels showing metrics for the products you have set up.
When to use the Home page
The Revenue Marketing Home page helps you to:
Quickly view highlighted metrics that matter most, and drill down into the account list and details.
Review trends and insights into your marketing programs.
Help you discover, prioritize, engage, and measure qualified accounts from prospects to pipeline.
Home page header
The top of the Home page shows information and settings relevant to all product metrics.
.png)
Number of de-anonymized accounts
Anonymous accounts are the total number of intent activities performed by anonymous sources, including keyword research, web activities, and ad impressions. When 6sense automatically de-anonymizes accounts, you can use the information to decide which accounts to target in your engagement activities and campaigns.
The [Number] De-anonymized accounts link at the top left goes to the Create segment page, where you can create new or browse existing segments (lists of companies) to use in 6sense Ads campaigns and Intelligent Workflows. Refer to Segments Overview.
Set the date range
Use the date range menu at the right to set the date range for the entire Home page. Choose between the last 7 or 30 days.
Highlights panel
The Highlights panel shows key performance metrics (KPIs) for your organization’s products, over the selected date range. Trend indicators also use the selected date range.
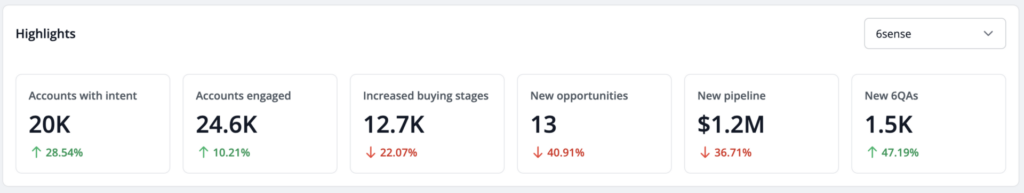
Depending on your organization’s 6sense setup, a product menu at the top right lets you set which product metrics to view. If your 6sense is not configured with multiple product offerings you won’t see this menu.
Many of the Highlight metrics are also available from the Segment Performance Reports.
The Home page displays KPIs based on what 6sense packages are installed for your organization’s account.
Highlighted KPIs for accounts with the Predictive add-on
If your 6sense installation includes Revenue Marketing and the Predictive add-on, the KPIs include:
Accounts with intent: Accounts showing intent across 6sense intent keywords and 3rd party data.
Accounts engaged: Number of accounts that came to your site after seeing your campaign (either directly through or indirectly as view-through).
Increased buying stages: Accounts that moved from an earlier to a later buying stage (towards the Purchase stage). Requires the Predictive add-on.
New opportunities: The count of relevant opportunities created within the date range.
New pipeline: The total dollar value of the associated pipeline of accounts with an engagement state of CRM Opportunities created within the date range.
New 6QAs: Number of 6QAs that have been opened and are active. Requires the Predictive add-on.
Highlighted KPIs for accounts with Revenue Marketing only
If your 6sense installation includes Revenue Marketing only, the KPIs include:
Accounts reached: Number of unique accounts that were touched as a result of your campaigns.
Closed-won opportunities: The count of tracked opportunities that were closed-won during the date range.
KPI drill down to account list and details
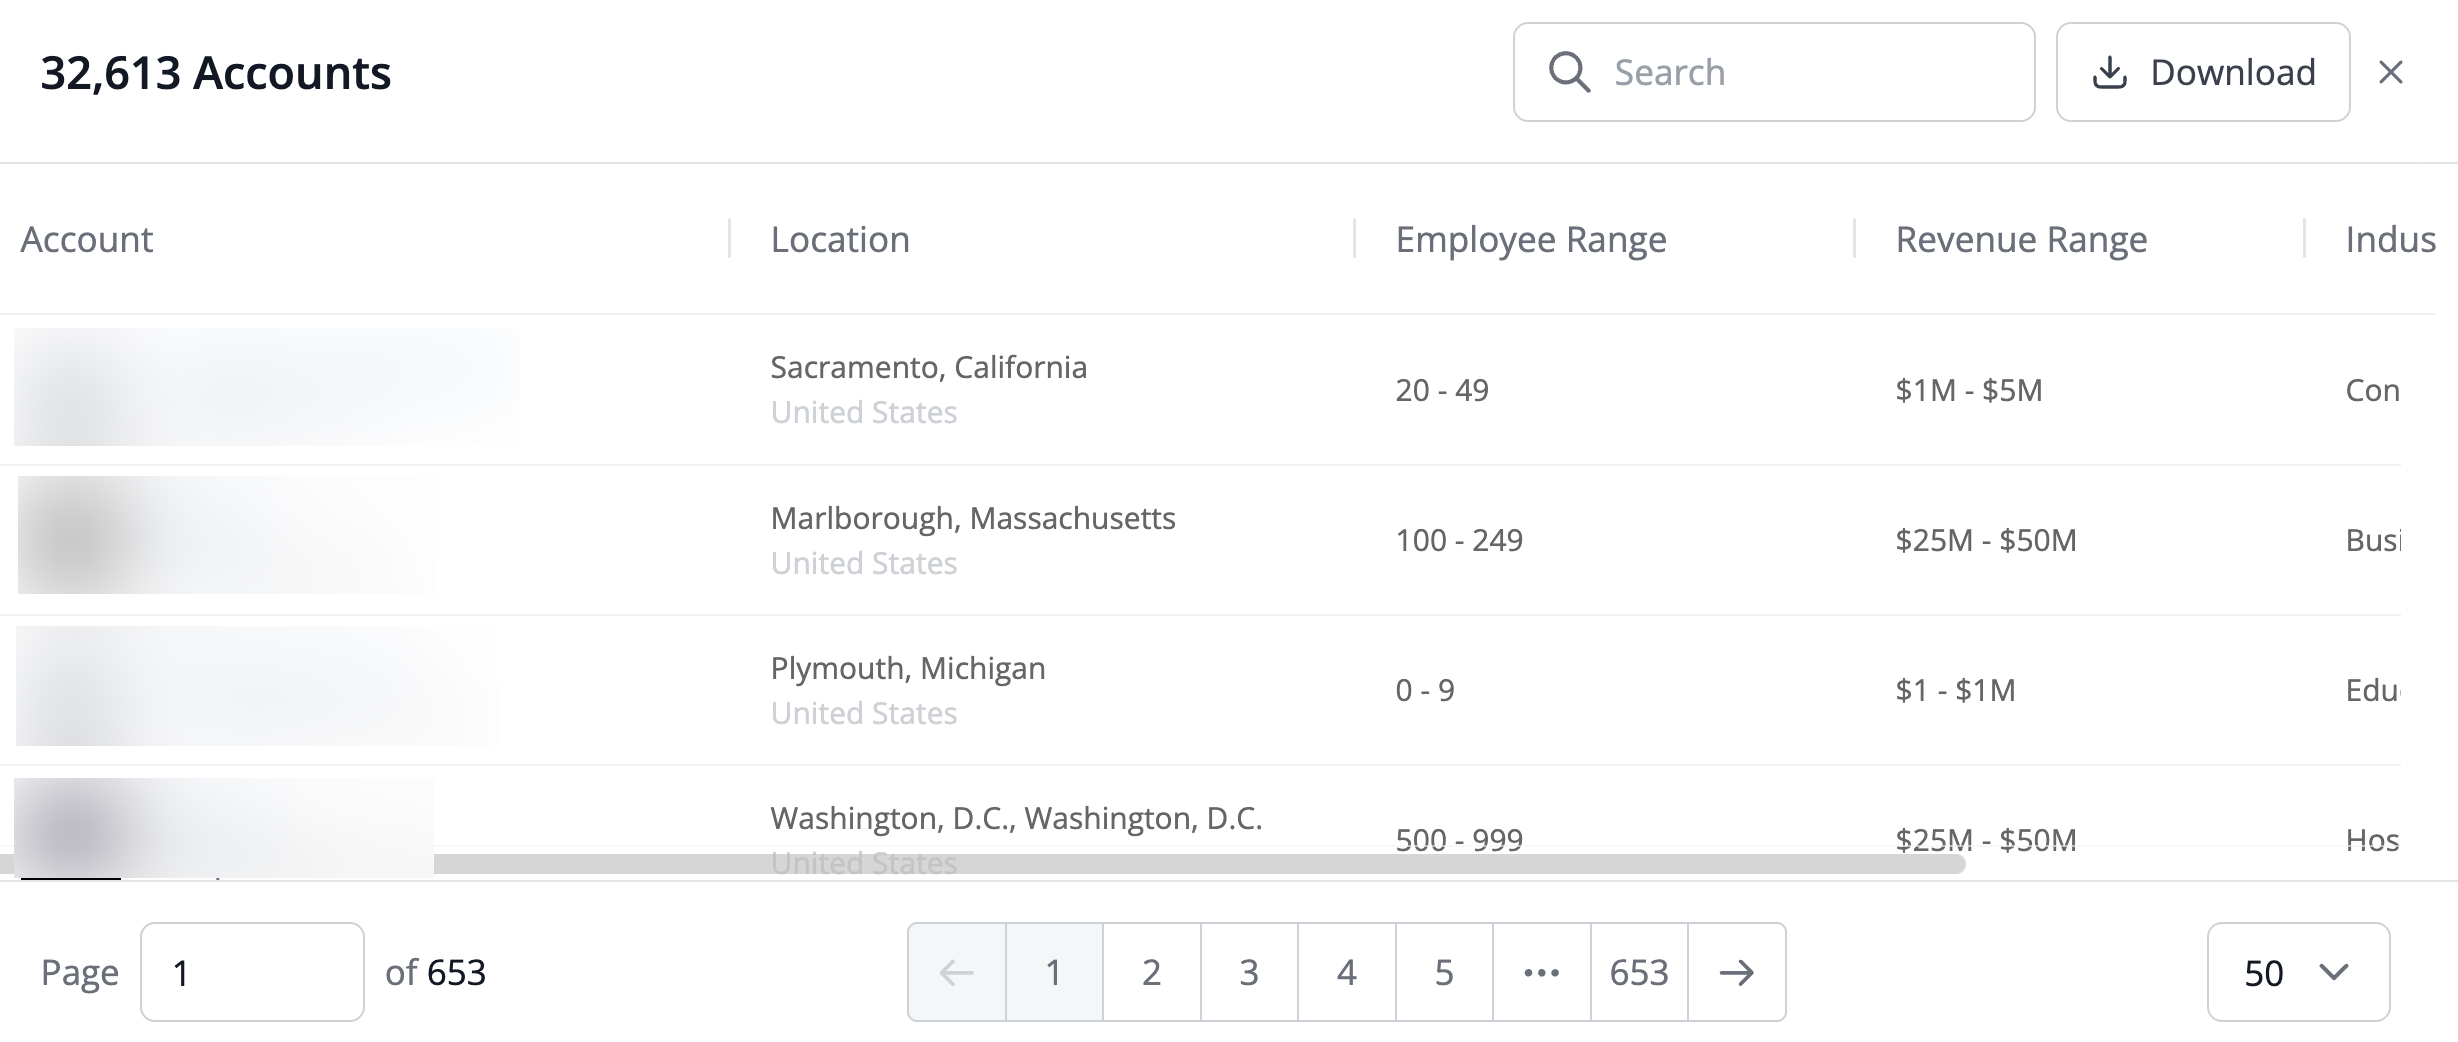
Select a highlighted KPI to find the accounts in that KPI (except New opportunities and New pipeline, which use opportunity as the primary object and currently is not supported). For example, you can select Accounts engaged and the Accounts list popup opens.
.png)
Use Search to locate specific companies.
Select a company to go to its account details page. Refer to Account Details.
Select Download to get a .xlsx file that has all the accounts in the KPI and more detail than what’s in the popup. Importantly, the .xlsx contains the MID and and CRM ID data that you can use to match against data in your other internal systems.
Intent activity panel
The Intent activity panel tracks web activity and keyword activity.
Website activity chart
The Website activity chart leverages WebTag 2.0 on your organization’s website to display how intent-related web activity is trending, so that you can identify spikes or drops in activity.
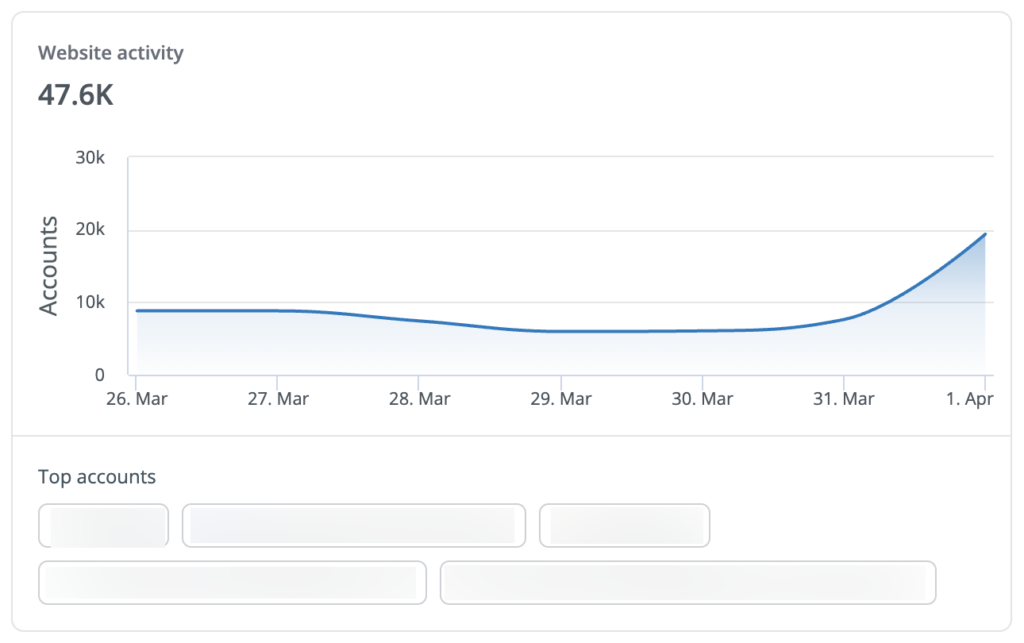
The Website activity chart also lists the top accounts with the most activity, so you can prioritize them for future campaign targeting or engagement. Refer to WebTag 2.0.
Keyword activity chart
The Keyword activity chart shows activity trends and the keyword groups with the most activity, so you can see what groups are the most popular.
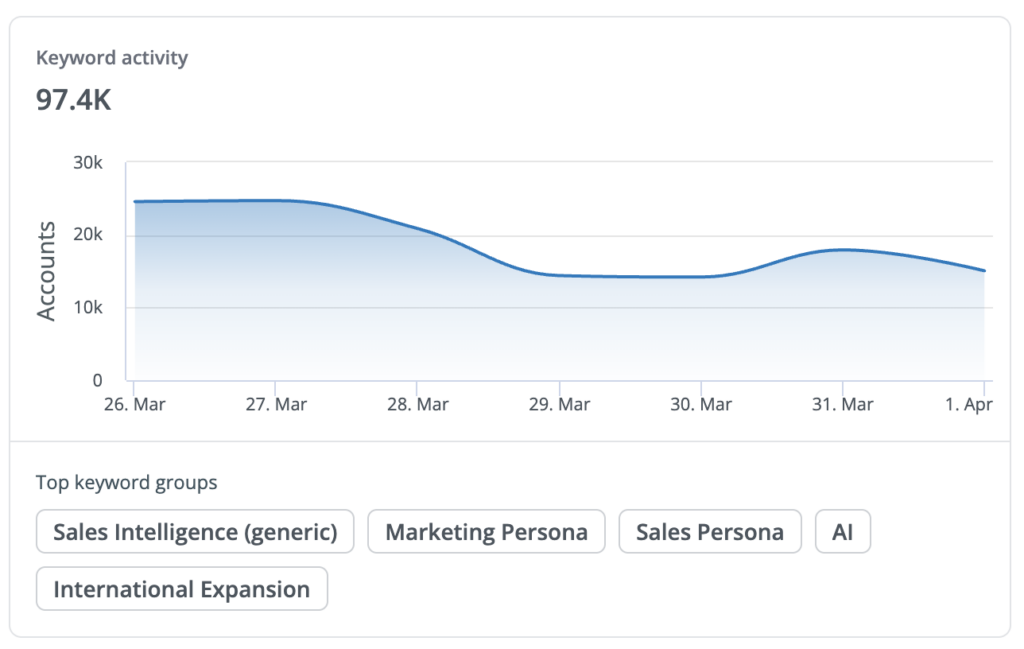
Use this knowledge to shape your creative materials and engagement strategies. Also refer to Manage Keywords.
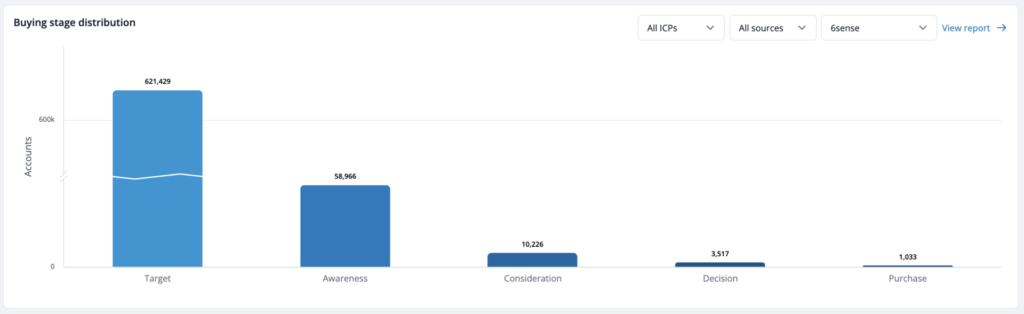
Buying stage distribution panel
If your 6sense installation includes the Predictive add-on, the Home page displays the Buying stage distribution panel.
The Buying stage distribution panel shows the distribution of buying stages (Target, Awareness, Consideration, Decision, Purchase) across ideal customer profile (ICP) accounts, so you can prioritize accounts and build appropriate creative materials. Refer to Predictive Buying Stages.
You can sort the buying stage data by:
ICPs:
All: (Default) All ICP accounts.
Strong: The account is a strong fit to the ICP.
Moderate: The account is a moderate fit to the ICP.
Weak: The account is a weak fit to the ICP.
Sources:
All Sources: (Default) Data from all data sources.
In CRM: Shows data only from your CRM.
Not in CRM: Shows data from 6sense intent analysis that is not in your CRM. Use this to identify accounts missing from your CRM that may be in a buying stage.
Product: If your organization has multiple Predictive product models, you can filter between them.
You can open the Segment Performance Report configuration from the View report link at the top right of the panel. Refer to Segment Performance Reports.
Last updated segments panel
The Last updated segments panel shows your most recently updated 6sense segments. Icons below the number indicate what activations are involved.
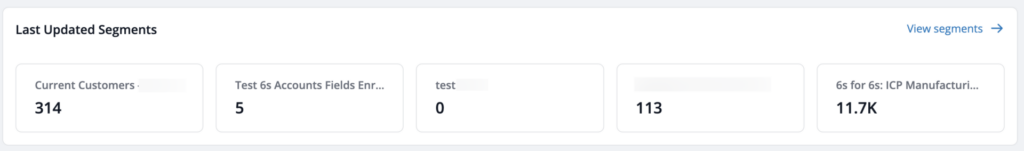
The View segments link opens the Segments page that lists all existing segments and lets you create new ones. Refer to Segments Overview.
Marketing activity panel
The Marketing activity panel is an overview of applicable Advertising, AI Email (formerly Conversational Email), Data and Audience Workflow, and Orchestration campaigns. If also applicable, it shows MAP and CRM campaigns.
Use these metrics to quickly learn how your active campaigns are delivering and if any need your attention.
Advertising tab Active campaigns
The Active campaigns list shows the number of active campaigns and breaks them down into delivery metrics.
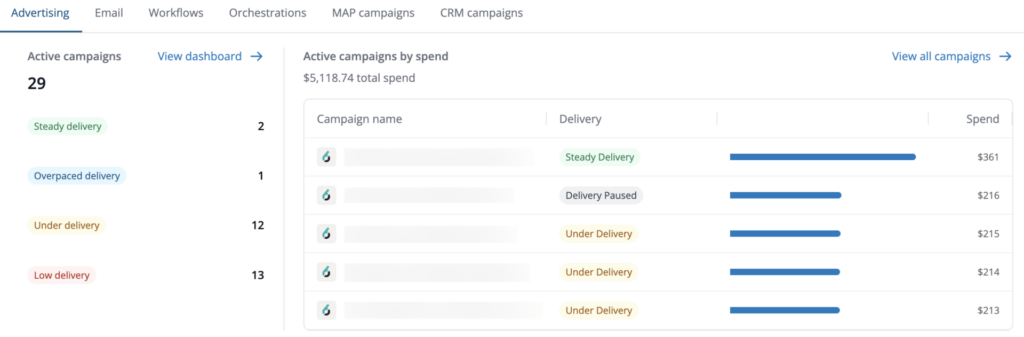
Delivery metrics include:
Steady Delivery: Indicates the pace at which your campaign is spending its budget. Steady delivery suggests that the campaign delivery is healthy and will exhaust >85% of the budget when the campaign completes. For campaigns with no end date, steady delivery indicates that the campaign delivery is >85% of the daily spend cap. This means the campaign will deliver in the expected timeframe.
Overpaced Delivery: Indicates that your campaign is spending more than it was supposed to during the time period and therefore could run out of budget before the scheduled end date. The Revenue Marketing platform will proactively inform you about the projected number of days the campaign will end in, so that you have sufficient time to take any action (if needed).
Under Delivery: Indicates mediocre performance suggesting a budget exhaustion rate between 50% to 85%. For campaigns with no end date, under delivery indicates that the campaign delivery is between 50% to 85% of the daily spend cap. This means the campaign will take slightly longer than expected to deliver the entire budget.
Low Delivery: Indicates a campaign’s struggle for inventory. You could review your campaign configuration settings like daily budget, max bid cpm, frequency capping, persona targeting, etc. For campaigns with no end date, low delivery indicates that the campaign delivery is <50% of the daily spend cap. This means the campaign will take considerably longer time to deliver the entire budget.
Select View dashboard to open the Advertising Home page. Refer to Advertising Home Page.
Advertising tab active campaigns by spend
The Active campaigns by spend list shows the total campaign spend above of the list of campaigns.
Select View All Campaigns to open the Advertising > Campaigns page. Refer to Advertising Campaigns.
Email tab email replies
The Email replies list shows reply status categorized by:
Started: Email was sent.
Reached: Email was delivered.
Opened: Received email and opened it.
Qualified: Received, opened, and replied to the email showing interest.
Select View all to open the Email insights page.
Email tab email campaigns
The Email campaigns list shows the number of emails sent, how many replies were received, and how many are qualified for each Email campaign.
Select View all to open the All campaigns page, where you can see all existing Email campaigns and create new ones.
Workflows tab
The Workflows tab shows the total of recently run Audience Workflows above a list of workflows. The list shows the last run date, schedule type, and status of each workflow. Use these metrics to ensure that your Audience Workflows are published and running as expected.
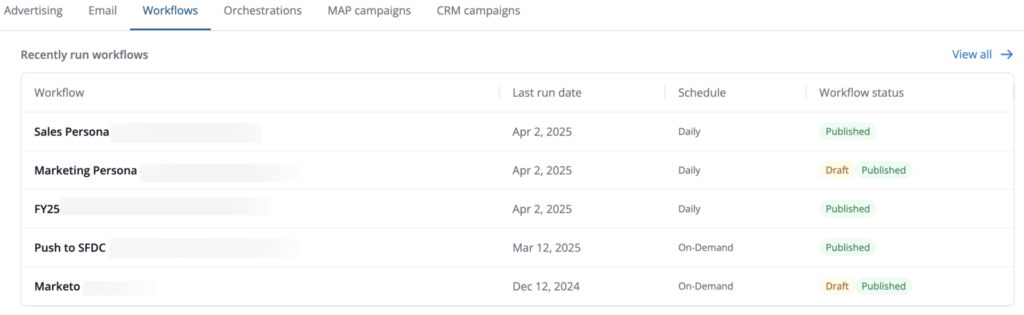
Select View all to open the Audience Workflows List page, where you can see all workflows and create new ones.
Orchestrations tab
The Orchestrations tab shows the total of active orchestrations above a list of orchestrations. The list shows the type and last run date of each orchestration. Use these metrics to ensure that your orchestrations are running as expected.
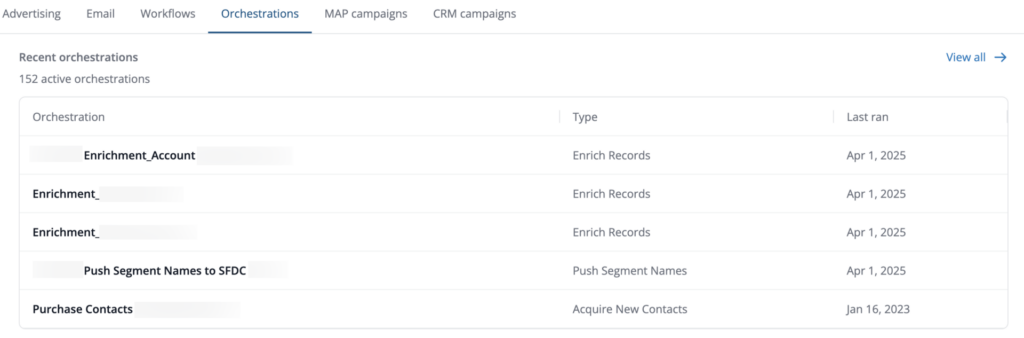 Select View all to open the Orchestration page, where you can see all orchestrations and create new ones.
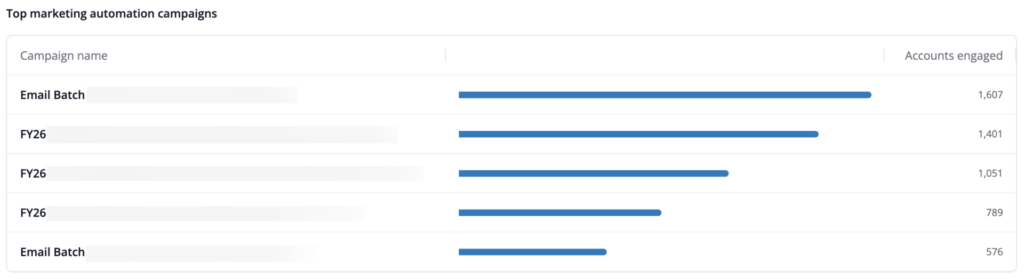
MAP campaigns tab
The MAP campaigns tab lists the top marketing automation campaigns by the number of accounts engaged.
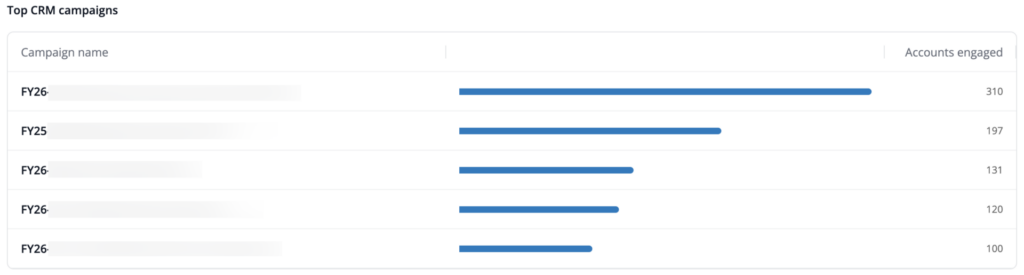
CRM campaigns tab
The CRM campaigns tab lists the top CRM campaigns by the number of accounts engaged.
Recent progress panel
The Recent progress panel displays the success of your Revenue Marketing engagements. The Home page displays metrics based on what 6sense packages are installed for your organization’s account.
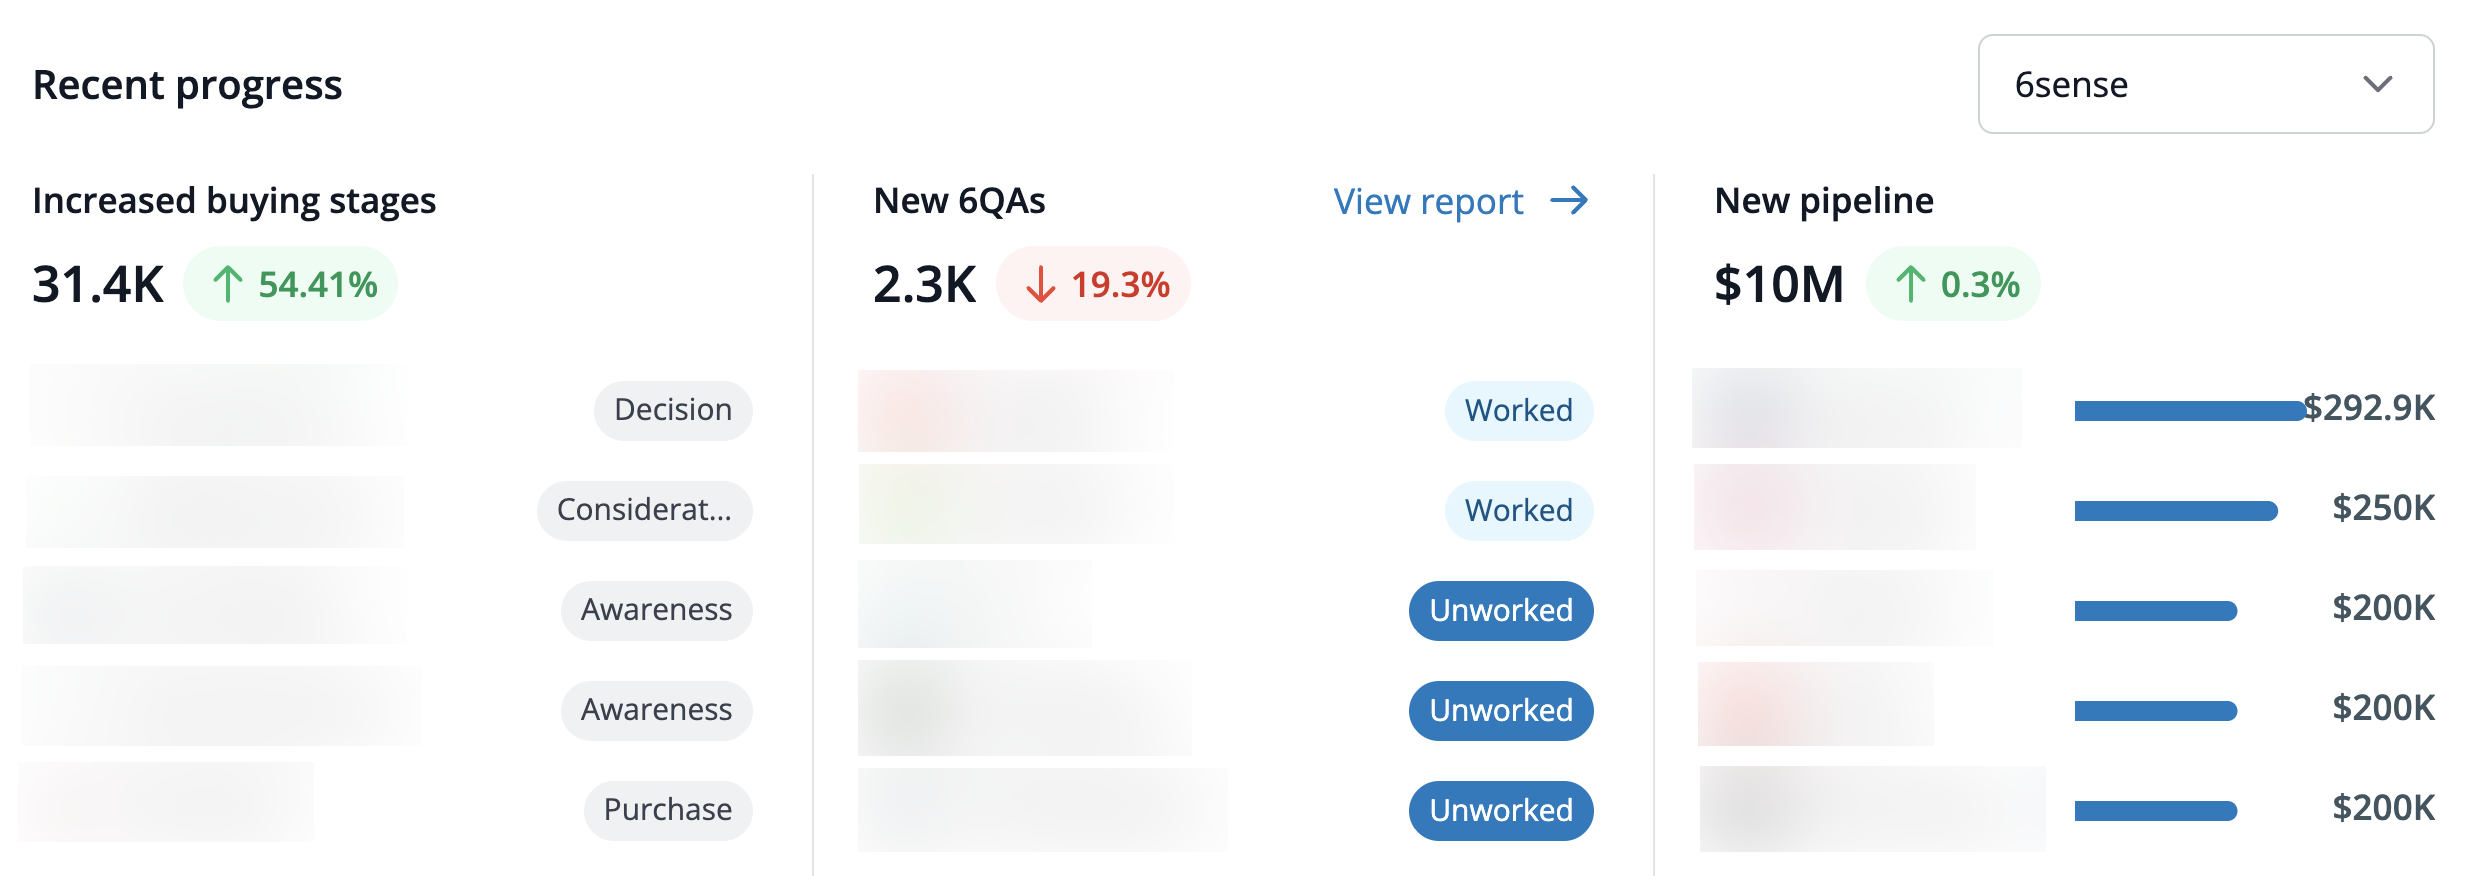
If you have multiple 6sense Predictive product models you can select one from the pulldown at the right.
Recent progress drill down to account details
In any Recent progress panel you can select a company to go to its account details page. Refer to Account Details.
Increased buying stage and New 6QAs list of accounts and details
For Increased buying stages and New 6QAs, you can select the main number to open a popup with the list of accounts.
Use Search to locate specific companies.
Select a company to go to its account details page. Refer to Account Details.
Select Download to get a .xlsx file that has all the accounts in the KPI and more detail than what’s in the popup. Importantly, the .xlsx contains the MID and and CRM ID data that you can use to match against data in your other internal systems.
Recent progress for accounts with the Predictive add-on
Increased buying stages: Shows the number and trend of accounts that have moved forward in their buying stage (towards Purchase). Lists the 5 most recent accounts that have increased their buying stage and shows their current 6QA buying stage. Select the main number to open a popup with the list of accounts, as described above.
New 6QAs: Shows the number and trend of accounts that are identified as new 6QAs. It lists 5 accounts with their Unworked/Worked status. Select the View Report link to open the 6QA Analytics report page.
New pipeline: Shows the dollar amount and trend of accounts with associated new opportunities. It lists the top 5 newest pipeline accounts by Opportunity value.
Recent progress for accounts with Revenue Marketing only
New opportunities: The count of relevant opportunities created within the date range.
Closed-won opportunities: The count of tracked opportunities that were closed-won during the date range.