The Performance Trend Report allows marketers to quickly understand how their campaigns are performing.
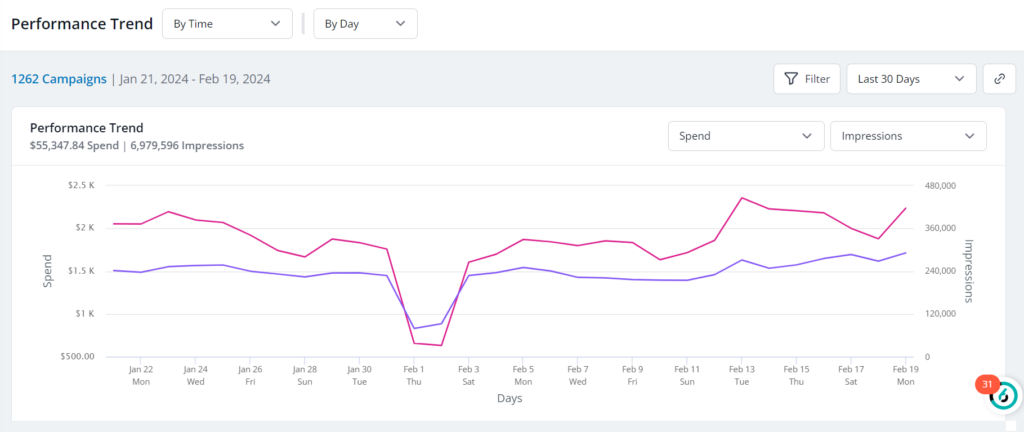
Access the report by navigating to the Reports tab from the left navigation.
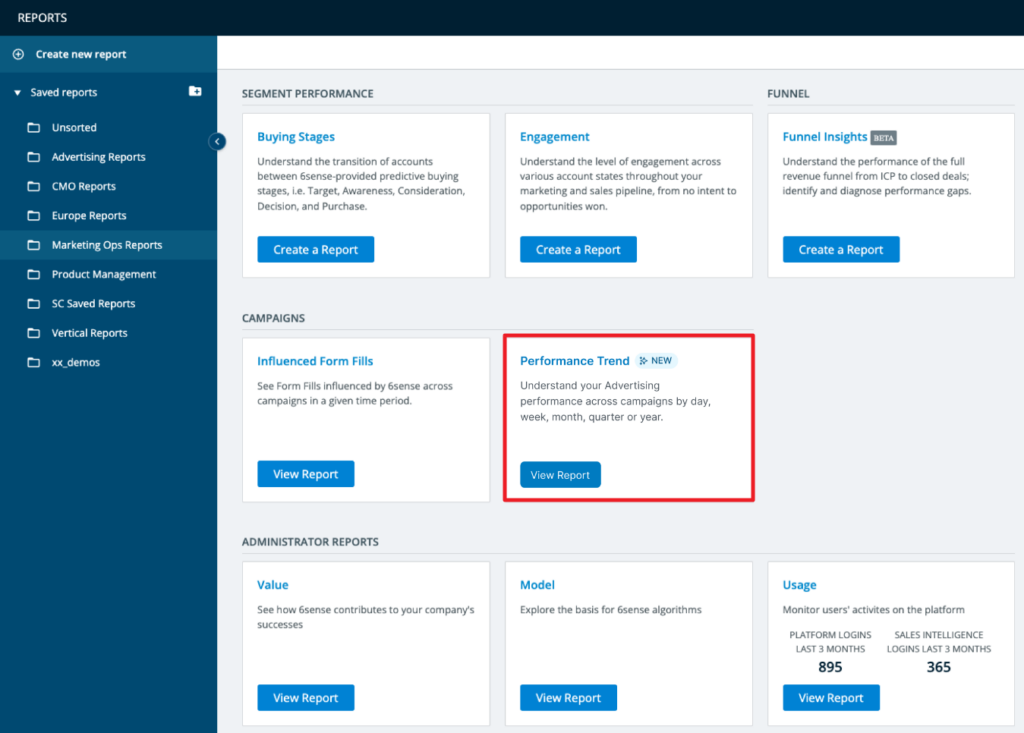
The report can also be reached from the Advertising dashboard.

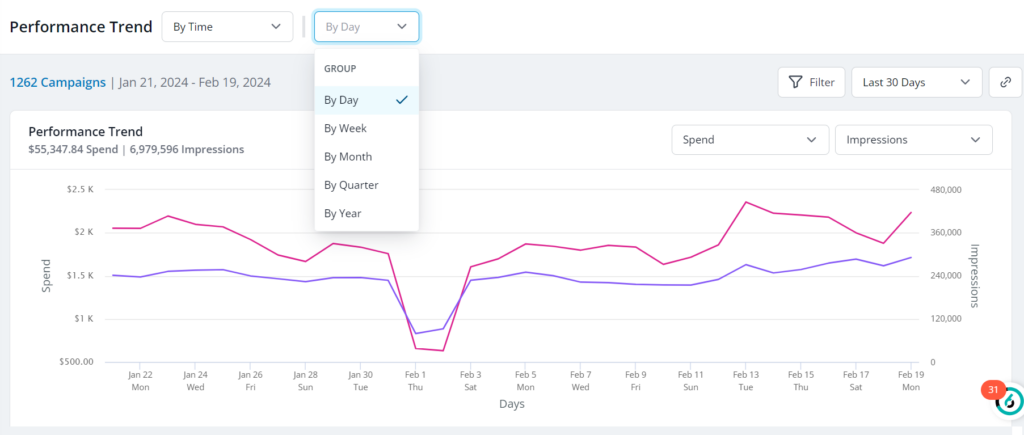
Users can group data by various time units: daily, weekly, monthly or quarterly.
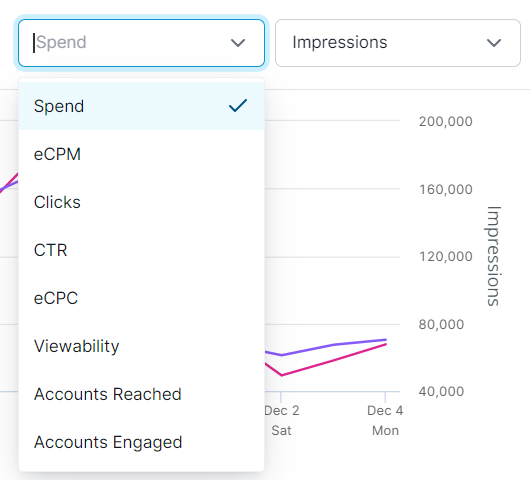
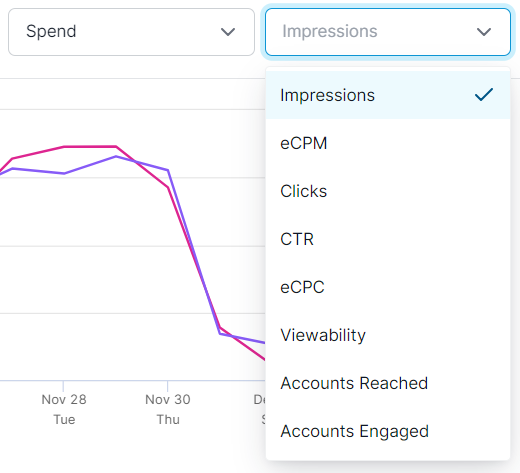
Visualize the relationship between two metrics on the chart by selecting from the drop downs at the top.
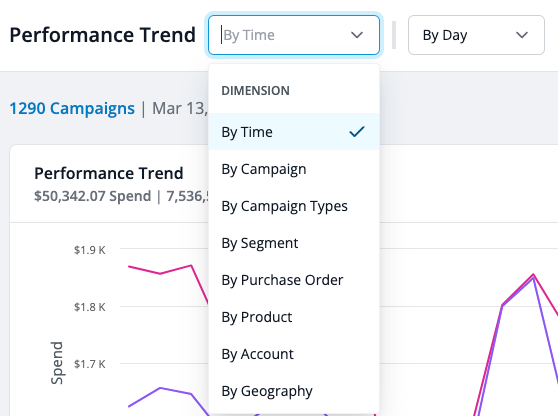
Adjust the dimension of data you want to examine by clicking on the dropdown By Time and selecting from the available dimensions.
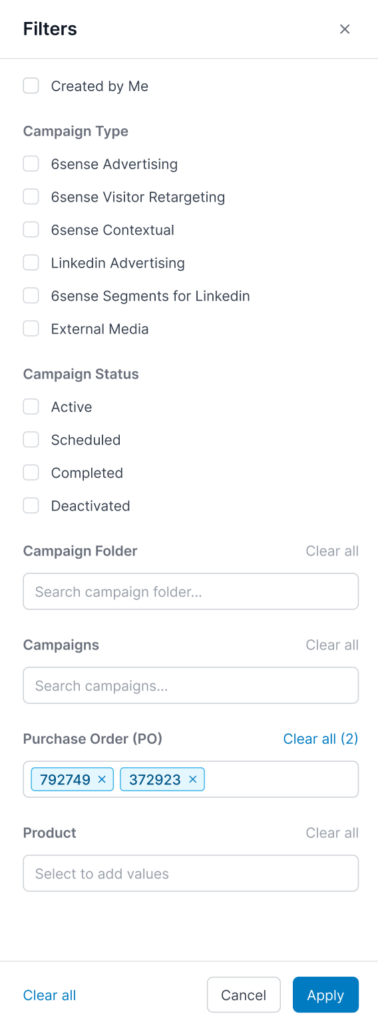
Slice campaign performance to reveal insights with easy-to-use filters. Search for specific campaign folders and campaigns in the fields at the bottom.
Modify columns to put your most important metrics front and center.
Visualize the relation between two metrics on the Performance Trend Chart. Spend, Impressions, eCPM, Clicks, eCPC, and Accounts reached are all available for plotting.

FAQ
Q: What are the earliest dates that can be queried?
A: Lifetime statistics are available for all customers.
Q: What campaign types are shown here?
A: 6sense Advertising, 6sense Contextual, 6sense Retargeting, LinkedIn Advertising, LinkedIn segment Syncs, and EMCs are included in PTR.
Availability of LinkedIn reporting is subject to LinkedIn minimums.
Q: What are the different time units available to group performance by?
A: The report can be grouped by the following time units: day, week, month, and quarter (calendar).
Q: How is the “last x days” lookback calculated?
A: We count backwards from the last completed day. For example, suppose you run a query for the last 7 days on Oct 27th 8am UTC. It would pull stats for Oct 20 through Oct 26th. There is lifetime data for the lookback feature.
Q: Is performance from External Media Campaigns included?
A: Yes – performance from EMCs is included.
Q: Is performance from LinkedIn Advertising campaigns included?
A: Yes – performance from LinkedIn Advertising campaign is included.
Q: Is performance from 6sense Segments for LinkedIn included?
A: Yes – performance from 6sense Segments for LinkedIn is included.
Q: What are best ways to use this report?
A: We recommend using this report to analyze popular time intervals that you can re-use and update for weekly, monthly and quarterly reporting.
Q: What day of the week does a “week” begin?
A: In 6sense reporting, weeks begin Monday, 00:00 UTC.
Q: What months do “quarters” represent?
A: We follow the calendar quarter schedule:
Q1 – January through March
Q2 – April through June
Q3 – July through September
Q4 – October through December
Q: How are Country & Region defined?
A: Our Country and Region level data uses 6sense account country and region. It is not where the impression was served itself.