Usage metrics charts show an organization’s use of 6sense. You can also download some of that data to CSV files for further analysis. Usage reports include user metrics, product metrics, and other metrics.
Other administrator reports include:
You must have Primary Administrator or Administrator permissions to access the Usage Metrics charts.
To access the reports:
Go to ABM > Reports.
Select Usage.
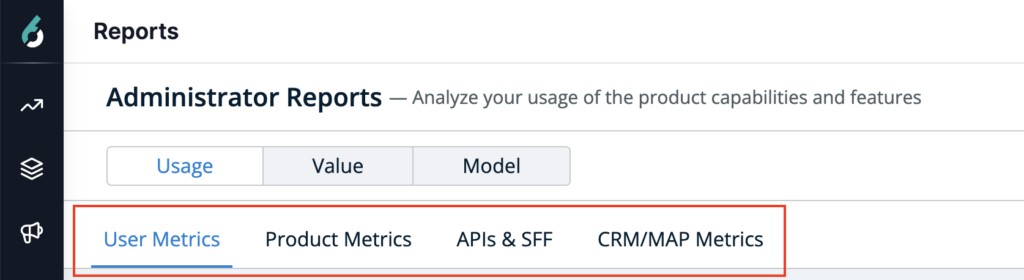
The report shows the Usage tab by default, which has User Metrics, Product Metrics, APIs & SFF or CRM/MAP Metrics subtabs.
You can select a timeframe for each displayed bar chart report.
Select a bar in a chart to open a popup of a table that has user details for the selected time period.
You can download the detail table data as a CSV file.
User Metrics subtab
The User Metrics subtab shows bar charts for ABM Platform logins and Sales Intelligence (SI) logins.
Usage > User Metrics Platform Logins chart
The Platform Logins chart displays the total number of enabled users (by email address) and the total user logins within the selected time period.
The information displayed is based on the number of users that have accessed the ABM platform at least once in the selected time period. (Logged in users could include users that are now disabled.)
The detail popup for any bar displays:
# of Users That Logged In: The total number of users logged in within the selected time period.
Username: User email.
Login Frequency: The number of times each user has logged in within the selected time period.
Usage > User Metrics > SI charts
For information about the SI Logins and SI Intelligence Adoption charts, refer to Sales Intelligence Usage Reports.
Product Metrics subtab
The Usage > Product Metrics subtab includes charts for:
Segments Created: The number of segments created in the selected timeframe.
Segments in Use: The number of segments in use in the selected timeframe.
6sense Campaign Spend: The amount of money spent on campaigns in the selected timeframe.
Accounts Reached: The number of accounts targeted and reached in the selected timeframe.
Unified Segment Sync Usage: Active channel syncs - An "actively synced segment" is a segment whose sync status is set to ON within the 6sense UI, across your organization.
Segments Synced to LinkedIn/Meta/Google: The total, current, and maximum daily segments synced to LinkedIn, Meta, or Google in the selected timeframe.
Alerts: The number of active alerts and alerts sent in the selected timeframe.
Orchestrations Credit Usage: Credits used by Orchestrations.
Sales Intelligence Credit Usage: Refer to Sales Intelligence Usage Reports.
Sales Intelligence Alerts: Refer to Sales Intelligence Usage Reports.
Workflows Credit Usage: Credits used by Audience Workflows. Opens the Workflows Credit Report.
APIs and smart form fill subtab
The Usage > APIs & SFF subtab includes API and smart form fill charts.
Usage > APIs & SFF > API charts
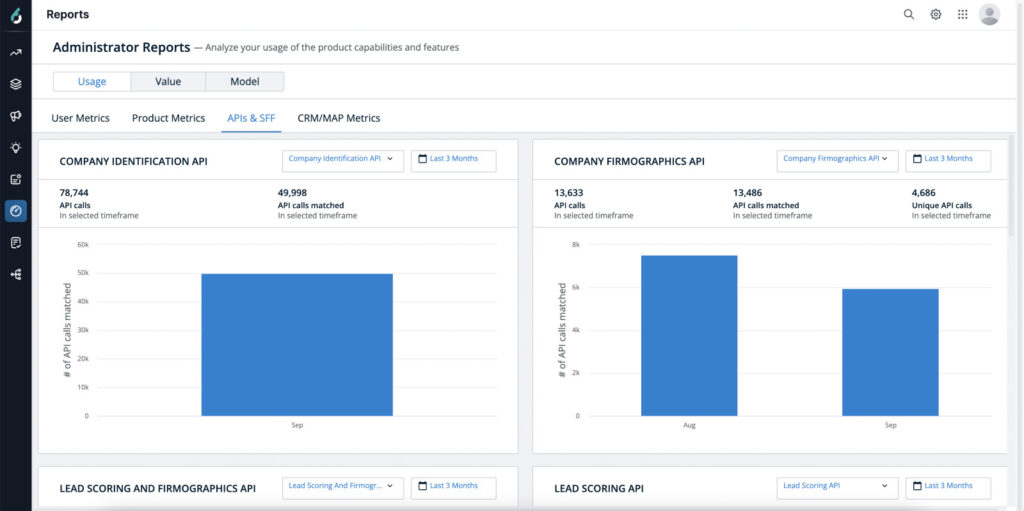
The API reports show the API usage. Reports are available for the last 3 months, 6 months, 9 months & 12 months. For any of these duration selections, you can see your month-to-month consumption of APIs.
API reports display for all the API tokens (active/disabled).
You can select a particular token to see its consumption.
API reports are available for the following APIs:
Company Identification API
Company Firmographics API
Lead Scoring and Firmographics API
Lead Scoring API
People Enrichment API
People Search API
Terms | Definition |
|---|---|
Total API calls | This includes all the API calls that were made. |
Total Matched calls | Total Matched API calls means where the API has returned a matched data. Matched API calls are used to deduct credits from Company Identification API Credits only |
Matched Percentage | Matched Percentage is calculated from “Total Matched calls” out of “Total API calls” |
Total Unique Calls | Total Unique Calls is a subset of Total Matched calls. i.e. total unique API calls across all the API tokens in a given month. This will be available only for Enrichment APIs and when “All API Token” option is selected. Enrichment APIs Credits are shared between People Enrichment API, Company Firmographics API & Lead Scoring and Firmographics API. |
Usage > APIs & SFF > Smart form fill chart
The smart form fill (SFF) report shows how many API calls were made to enrich forms on your website that use the smart form fill feature. Refer to Smart Form Fill.
Reports show consolidated data across all your SFF-configured forms.
Total API calls: The total API calls made for the Email Address through People Enrichment API.
Total API Calls matched: Total Email Address match found and form enriched with People & Company data.
Unique API calls: Total unique Email Address match found and form enriched with People & Company data.
CRM/MAP Metrics subtab
The Usage > CRM/MAP Metrics subtab includes:
CRM Data Sync chart: The number of records imported or exported from your CRM in the selected timeframe.
MAP Data Sync chart: The number of records imported or exported from your MAP in the selected timeframe.